Notes on:
Geoeconomic Fragmentation and the Future of Multilateralism
IMF Staff Discussion Note 2023/001
27 February 2023
geoeconomics · fragmentation · trade policy · international monetary system · IMF
Talk · Paper · doi · PDF · Transcript
Made with AI: Fable 5.1 (reading and writing)
Shekhar Aiyar, Jiaqian Chen, Christian Ebeke, Roberto Garcia-Saltos, Tryggvi Gudmundsson, Anna Ilyina, Alvar Kangur, Tansaya Kunaratskul, Sergio Rodriguez, Michele Ruta, Tatjana Schulze, Gabriel Soderberg and Juan Pedro Trevino, all at the imf (Research Department and Strategy, Policy, and Review Department), with contributions from Tohid Atashbar and Rex Ghosh. imf Staff Discussion Note sdn/2023/001, January 2023, 38 numbered pages including four annexes. The digest is written from the published note. Aiyar presented it at an Oesterreichische Nationalbank–suerf session in Vienna on 22 February 2023, chaired by Birgit Niessner (OeNB), with Michael Plummer (sais Europe, Johns Hopkins, joining from Bologna) and Susanne Weigelin-Schwiedrzik (Austrian Academy of Sciences) as discussants; the talk is used where noted. Two slides are taken from the talk; Box Figure 1.1 and Figures 6–9 are cropped from the pdf.
A word, a channel list, and a range
This is not a paper with a result. It is a paper with a definition, and the definition is the result. Most of its main text is the literature on the benefits of globalization run backwards; the rest is the plumbing of the international monetary system and what the imf would like everyone to do. Nobody on this list reads it for a mechanism; everyone cites it in the first paragraph, because it is where the phrase they are using was pinned down. So take the definition apart and see how the numbers everyone quotes were assembled.
The definition is on page 5:
Policy-driven reversal of integration, often guided by strategic considerations, will be referred to as geoeconomic fragmentation (gef) in this paper. gef encompasses reversals along any and all of the different channels whereby countries engage with each other economically, including through trade, capital flows, the movement of workers across national boundaries, international payments, and multilateral cooperation to provide global public goods.
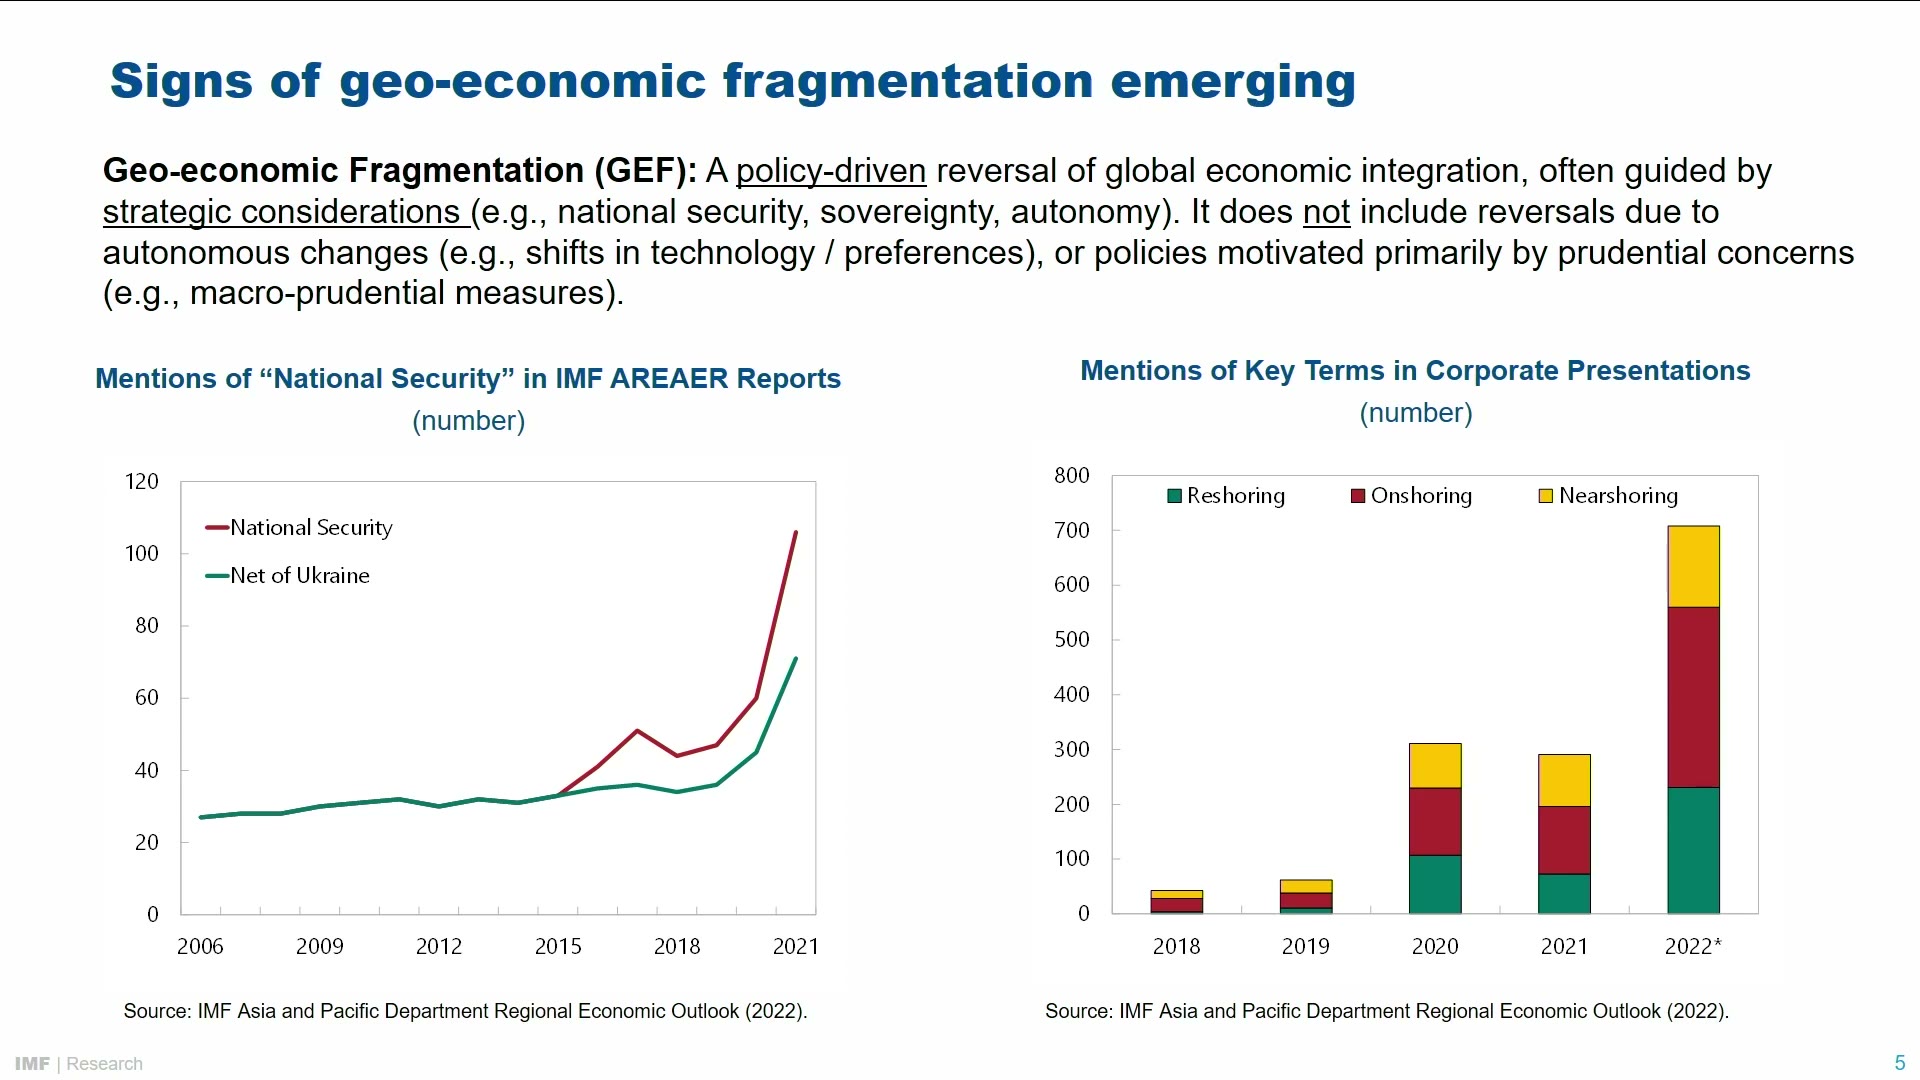
Read it as a lawyer would. “Policy-driven” excludes reversals that come from tastes and technology: a shift in demand from goods (tradable) to services (less so) is not fragmentation. “Guided by strategic considerations” is softened by “often”, and the list of motives that follows admits national security, autonomy and rivalry but also “primarily domestic economic policy objectives” such as keeping production at home. So the “geo” in the name is aspirational. An ordinary protectionist tariff qualifies; only a coordinated prudential measure and a taste shock do not, and the note concedes, in a sentence its copy-editor missed, that “there is often no bright light between prudential and protectionist policies.”
Notice what kind of concept this is. Clayton, Maggiori and Schreger (2026) define geoeconomics from the top down, as the use of economic dependence to make threats: a concept about power, identified by finding a coercer. The imf defines fragmentation from the bottom up, as an observed reversal of integration with a policy behind it: a concept about consequences, identified by finding a barrier and asking who imposed it. A tariff imposed to win Pennsylvania is fragmentation in the second sense and not much in the first. The papers on this list that count barriers work in the imf’s sense and the papers that model threats in the other, and some of their apparent disagreement is the two definitions passing each other.
Is it happening?
The note’s evidence section is candid to the point of undercutting its title. “While there are few clear signs of fragmentation in the trade data yet (outside of sanctioned countries and entities), the number of protectionist measures is rising” (p. 10). What has risen is the count of interventions, the vocabulary of security in official reports, and the vocabulary of resilience in corporate ones.

None of this is a trade flow. It is the announcement of intentions in three registers, and the note’s honest position is that intentions are what can be measured so far. Gopinath and co-authors (2025) and Alfaro–Chor (2023) later go looking for the flows; this note is the one that says, in January 2023, that they had not yet shown up.
How the numbers are built
Box 1 is the part that gets quoted, so be precise about what it is: a summary of four other papers, all model-based, all from inside the imf or the wto. The note says so itself: “most analyses focuses on modeling exercises as opposed to empirical estimation” (p. 14). Each divides the world into blocs, raises a wall of some height between them in some set of sectors, and lets a general-equilibrium model reallocate until it settles; the number is the long-run difference in real income between the settled world and the pre-wall one.
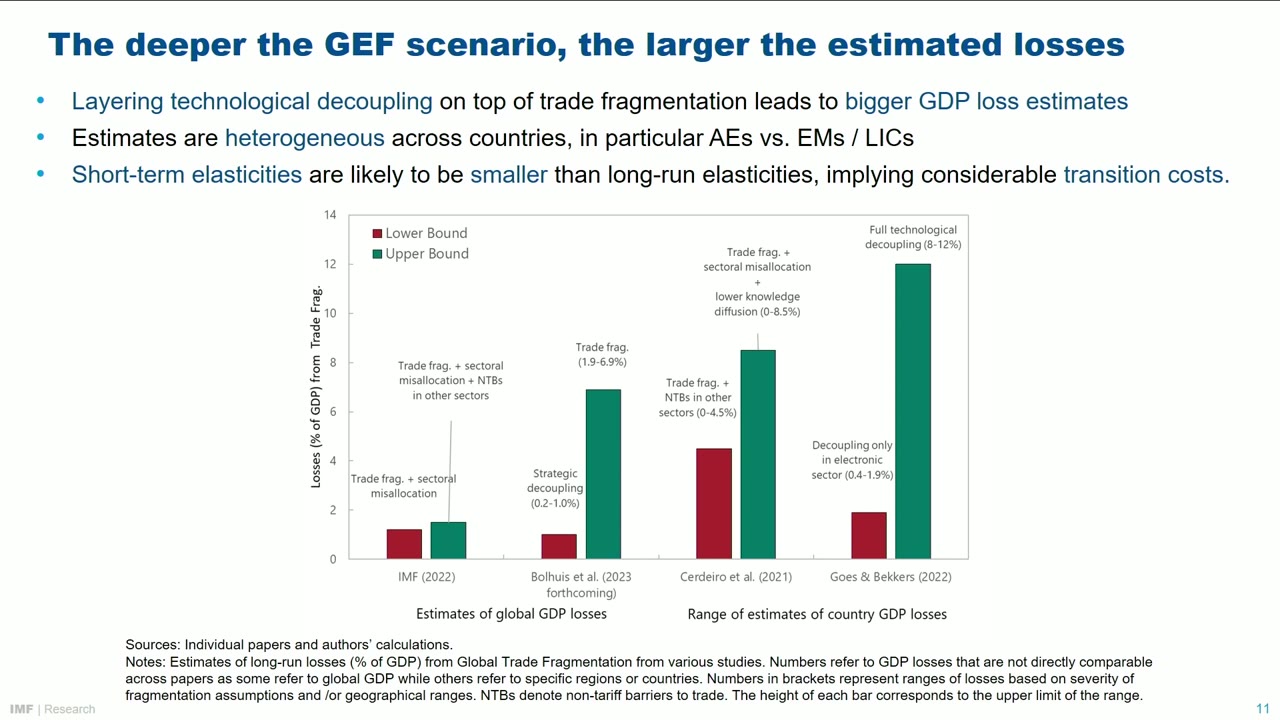
The four, in the note’s order. imf (2022a) removes trade in high-tech manufacturing and energy between blocs defined by the March 2022 un General Assembly vote on Ukraine and gets a world loss of 1.2 percent, 1.5 with non-tariff barriers added elsewhere. Bolhuis, Chen and Kett (2023), cited as forthcoming, run partial barriers between blocs and then zero inter-bloc trade, and get 0.2 to 1 percent and 1.9 to 6.9 percent of world output, the spread inside each coming from the assumed trade elasticity. Cerdeiro and co-authors (2021) stack trade barriers, sectoral misallocation and lower knowledge diffusion and report up to 8.5 percent for the worst-affected countries, with some countries gaining from trade diversion in the mild cases. Goes and Bekkers (2022) model knowledge diffusion between an East and a West bloc and find 0.4 percent for some countries under limited decoupling and up to 12 percent for the most exposed under full technological decoupling.
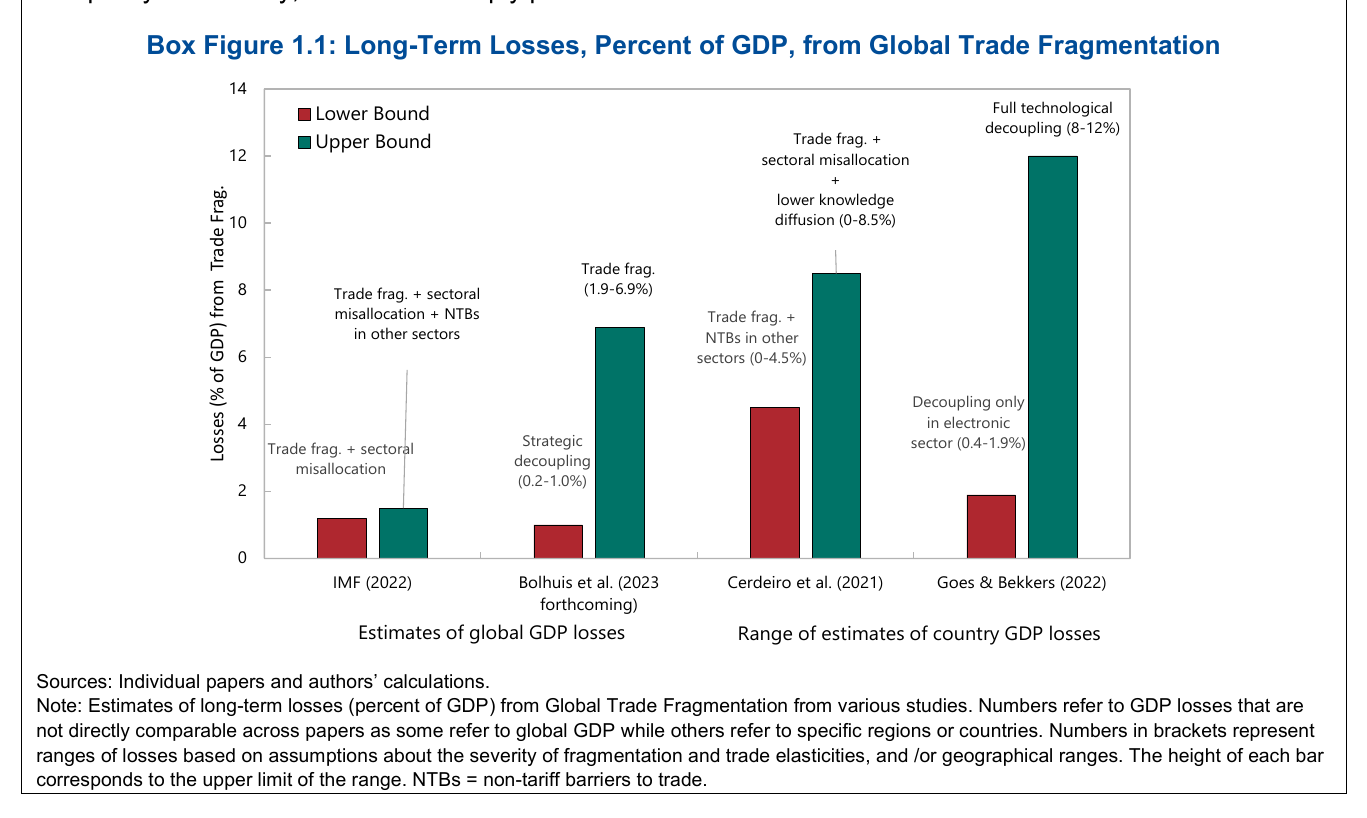
Look at the figure before reading the sentence that summarizes it. There are eight bars, two per study, a red one for the study’s milder scenario and a green one for its severe one, each labelled with what was done to trade and the range the study reports; the bar’s height is the top of that range. imf (2022a) is 1.2 and 1.5. Bolhuis, Chen and Kett is 1.0 for what the label calls strategic decoupling (0.2 to 1.0) and 6.9 for full trade fragmentation (1.9 to 6.9). Cerdeiro and co-authors is 4.5 for trade barriers plus non-tariff barriers in other sectors (0 to 4.5) and 8.5 with the knowledge-diffusion layer added (0 to 8.5). Goes and Bekkers is 1.9 for decoupling in electronics alone (0.4 to 1.9) and 12 for full technological decoupling (8 to 12). The x-axis does the work: the first two studies sit under “Estimates of global gdp losses” and the last two under “Range of estimates of country gdp losses”. So the split the figure draws is world number against country range, not trade against technology. Cerdeiro’s red bar has no knowledge-diffusion layer in it at all. The right-hand pair are taller for two reasons at once, because their green bars carry a technology channel the left pair lack, and because they report the worst-hit country rather than the world average, and the figure does not let you separate the two.
Now the number. The executive summary on page 4 says the cost of trade fragmentation “could range from 0.2 percent (in a limited fragmentation / low-cost adjustment scenario) to up to 7 percent of gdp (in a severe fragmentation / high-cost adjustment scenario)”, and this is quoted everywhere as if it were the span of the literature. It is not. It is the range of one study, Bolhuis, Chen and Kett, a paper the note could only cite as forthcoming: 0.2 to 1 percent in their limited scenario and 1.9 to 6.9 in their severe one, so that 0.2 is the floor of the first and 7 is the ceiling of the second, rounded. Two things vary inside that range and nothing else. The scenario: partial trade restrictions between blocs, or two rival blocs with zero trade between them. And the trade elasticity, the parameter that converts a barrier into a welfare loss by setting how easily buyers substitute away from the blocked supplier; the summary’s “low-cost adjustment” is a high elasticity and its “high-cost adjustment” a low one, and the studies set this parameter rather than estimate it. Whether third countries may trade with both blocs is also varied, in this paper and in Cerdeiro’s, the two of the four that ask; in both, losses are larger when the nonaligned are forced to pick a side, because they are the substitution margin that keeps the cost down. The other two studies assign every country to a bloc by its un vote and never pose the question. So the headline world range is a single trade-only, long-run model run under two scenarios with two elasticities, which is exactly why its two ends can be compared with each other: two blocs, autarky between them and a low elasticity give you 7 percent of world output; partial restrictions and easy substitution give you 0.2. Which world you are in is not a modeling question.
The apples-and-oranges problem is real, but it is in the next clause. The summary continues: “with the addition of technological decoupling, the loss in output could reach 8 to 12 percent in some countries.” That is Goes and Bekkers’ full-decoupling range for the most exposed countries, a country-level figure from a model with a knowledge-diffusion channel, stapled onto a world-level figure from a model without one, and the sentence reads as if the second were the first with one more layer switched on. The “8 to 12 percent” that travels into every speech is the tallest bar in the right-hand pair, not a world number and not a central case. Box 1 says, in its text on page 14, that “the papers look at different regions so results cannot be directly compared across papers”, and the note under the figure says it again. The executive summary then puts two of them in one sentence.
That is not a criticism of the modelers, who were answering different questions, and only mildly one of the note, whose authors gave what Aiyar at the talk called “a health warning” before saying the studies were “really apples and oranges”. It is a description of what a scenario is: assumptions chosen to be plausible, run through a model whose parameters were also chosen, with the output inheriting the status of the inputs.
Two things the note says about its own numbers should travel with them. Everything in the figure is a long-run loss, and since short-run trade elasticities are much smaller than long-run ones (the note cites Boehm, Levchenko and Pandalai-Nayar 2023), the transition is costlier than the destination. And the estimates cover trade and technology only, with nothing costed for migration, capital flows, uncertainty or public goods, so the numbers “should not be taken as an upper-bound” (p. 15). Both are mechanisms rather than scenarios, and they are what carries the note from a box of bars that do not compare to the sentence that the deeper the fragmentation, the deeper the cost.
What is a mechanism here
Strip out the scenarios and the note contains three mechanisms, none original to it. Trade barriers raise import prices and the incidence falls on domestic buyers, for which it cites the 2018–19 trade-war literature, Fajgelbaum and co-authors (2020) included. Technological decoupling compounds, because productivity growth away from the frontier depends on access to frontier knowledge, so a barrier that also blocks diffusion has a growth effect and not just a level effect; this is why emerging and low-income economies lose most in every study. And the monetary system relies on risk-sharing, which fragmentation removes: fewer sources of external finance, shocks more correlated within a bloc, safety-net resources pooled regionally rather than globally, and a creditor base for poor countries in which the Paris Club has gone from 48 percent of external debt in 1996 to 12 percent in 2020, so that any restructuring becomes a negotiation between blocs. The note argues crises could become less frequent, because shocks stop transmitting across blocs, and more severe, because fewer resources meet them; Aiyar, presenting it, said of “more severe” that he was not sure about that, only that crises would be harder to resolve.
The monetary section is the one part later papers take from the note directly rather than merely cite. The freezing of some 300 billion dollars of Russian reserves, central bank gold purchases of 399 tons in the third quarter of 2022 against a quarterly average of 119 since 2010, and the imf as “the only layer that provides universal coverage” of the safety net are the raw material for the block-three papers on the dollar and sanctions. So is Annex 1, the note’s one model simulation of its own, which runs an uncertainty shock through the imf’s debt-sustainability framework and finds an emerging market would need to cut public debt by 3.4 percentage points of gdp over five years, 6 to 15 in the top quartile, to keep its risk exposure constant: a scenario too, but one that prices self-insurance.
The talk
The Vienna session added three things. Plummer, presenting general-equilibrium work with Peter Petri that lands in the middle of the note’s range, said his group preferred the term geopolitical restructuring, because “geoeconomic fragmentation sort of suggests that it’s coming from the economy, yet it’s driven by policy,” which is a fair objection to the name; he also pressed on fdi, where flows have been flat since the crisis while the global stock went from 18 to 45 trillion dollars between 2009 and 2021, and asked whether integration had moved behind the border. Weigelin-Schwiedrzik, a sinologist, made the model’s nonaligned countries into a political argument: a country outside both blocs can bargain over the terms of joining either, a member cannot, which is why so many governments refuse to choose. It is the substitution margin of Cerdeiro and Bolhuis–Chen–Kett described from the inside. The most useful moment is Aiyar’s reply, where he previewed the fdi chapter of the April 2023 World Economic Outlook (2023): bilateral geopolitical distance measured from un voting records, the ideal-point distance of the political scientists, predicts bilateral fdi with a coefficient that has risen sharply, and in what he called a horse race against physical distance it is both larger and rising more steeply. That is the bloc definition Gopinath, Gourinchas, Presbitero and Topalova later use for trade and fdi together, described in embryo two months before publication.
Where it sits
Context in sub-block 1.2, and the shortest entry in it. It is on the list because the empirical fragmentation papers, Gopinath and co-authors, Alfaro–Chor and the connector-country work, are written in its vocabulary, and because the three-definition problem, the Clayton–Maggiori–Schreger power concept, Mohr and Trebesch’s (2025) interdependence concept and the imf’s consequence concept, cannot be stated without it. It has no mechanism of its own, which is why it is context and not a presented paper, and why a historical estimate of fragmentation costs (Campos, Heid and Timini 2024 on the Iron Curtain) was kept on the list over a forward-looking scenario: an estimate is evidence and a scenario is an assumption. The cepr volume edited by Aiyar, Presbitero and Ruta (2023) later that year has the same material at chapter length; the parts of this one to read are the definition, the evidence figures and Box 1.
The caveat it imposes downstream is the one it imposes on itself. When a later paper opens by saying fragmentation could cost up to 7 percent of world gdp, it is quoting one 2022 model’s severe scenario at its low elasticity, and has borrowed the number’s precision without the health warning. The note wrote the warning down, in the box on pages 14 and 15, and the number on page 4, in the executive summary, which is the page everyone reads.