Notes on:
The Stabilizing Role of Net Foreign Asset Returns
IMF Working Paper 18/79
1 March 2018
international macro · net foreign assets · valuation effects · external adjustment · IMF
Paper · PDF
Made with AI: Opus 5.5 (reading and writing), GPT 6.1-Sol (reading), Fable 5.1 (adjudication), GPT 6-Astra (verification)
Gustavo Adler and Daniel Garcia-Macia, imf Working Paper wp/18/79, March 2018. This is the March 2018 working-paper version; there is no talk or discussant. Page numbers are the paper’s printed pages.
Adler and Garcia-Macia’s paper is about a country’s balance sheet against the rest of the world, and its main finding is that the balance sheet partly corrects itself. It doesn’t do this through the trade balance, which is where textbooks put the adjustment. It does it through the prices of the country’s own stocks.
The accounting
You are a country. You own foreign assets , foreigners own claims on you , and your net foreign assets are . Two things move that number each year. You can run a trade surplus and pile up claims on foreigners, which the paper treats as the choice variable. Or the portfolio you already hold can earn something: interest and dividends, plus the change in price of everything on both sides of the ledger, currency moves included. The paper calls the second thing the nfa return and defines it as income balance plus valuation change. The definition matters more than it looks. The current account, which the older literature studied, puts trade together with the income part of returns and leaves valuation out entirely. Adler and Garcia-Macia put trade on one side and all financial returns on the other. That also makes the debt/equity form irrelevant, since debt pays you in coupons and equity pays you mostly in capital gains, and total return doesn’t care which.
Scaled by gdp, the law of motion is (eq. 2 in the paper, p. 6):
Here is net foreign assets over gdp, the trade balance over gdp, the nominal nfa return (income plus valuation) over gdp, inflation and real growth, so is the real return net of inflation eroding last year’s stock and is the mechanical shrinking of the ratio as gdp grows. The “≈” is honest: capital-account flows, errors and omissions, and a cross term are dropped as small (the exact version is in a footnote). One more thing to keep in mind is that valuation is not observed. It is backed out as the change in the stock minus the financial-account flow. The authors check this on a confidential subsample, about a sixth of country-years, where the reconciliation residual averages roughly zero for most countries.
The paper also splits returns as a rate on gross stocks, not as a share of gdp: the return differential , broken into a yield gap, an exchange-rate gap (from estimated currency shares) and an asset-price gap, which is whatever is left. So the asset-price piece, which ends up carrying the paper, is a residual of a residual. The authors say to read it with caution, and you should.
Why anyone should look at returns at all
Gross foreign assets and gross foreign liabilities each went from roughly 60 percent of world gdp to roughly 160 percent over the sample (each side, not the two added together). The sample is 52 economies covering more than 85 percent of world gdp, 1990–2015. When gross positions are that large, a modest return gap becomes a large flow, and it can be larger than trade.
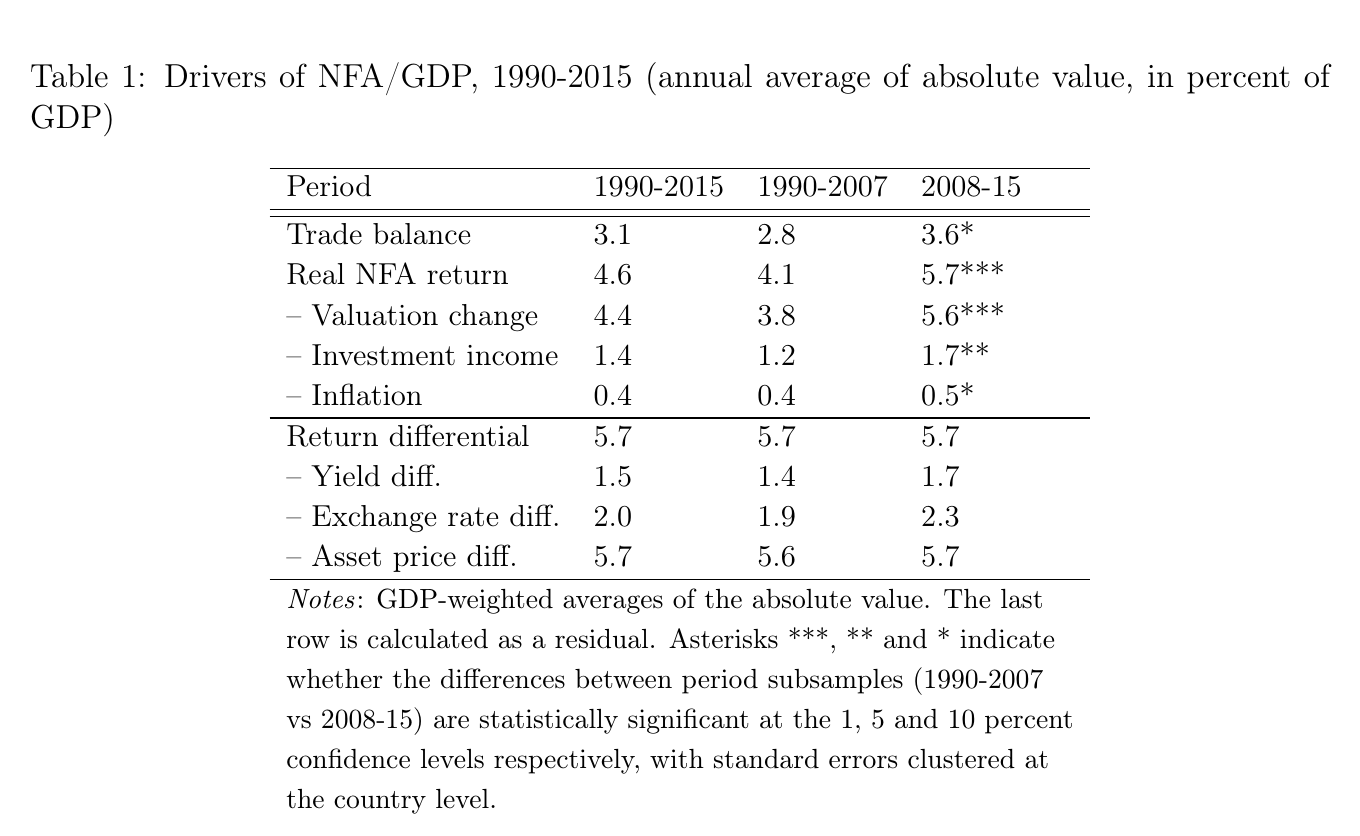
Table 1 shows this. The average absolute real nfa return is 4.6 percent of gdp a year, against 3.1 for the trade balance, and 4.4 of that 4.6 is valuation. After 2008 returns rise to 5.7 while the return differential stays flat at 5.7 in every period. So the rate gaps did not get bigger; the stocks did. (These are averages of absolute values, so they don’t add up to anything. Unweighted, in the appendix, returns still beat trade, but the post-crisis increase is no longer significant.)
The country table is where the fun starts.
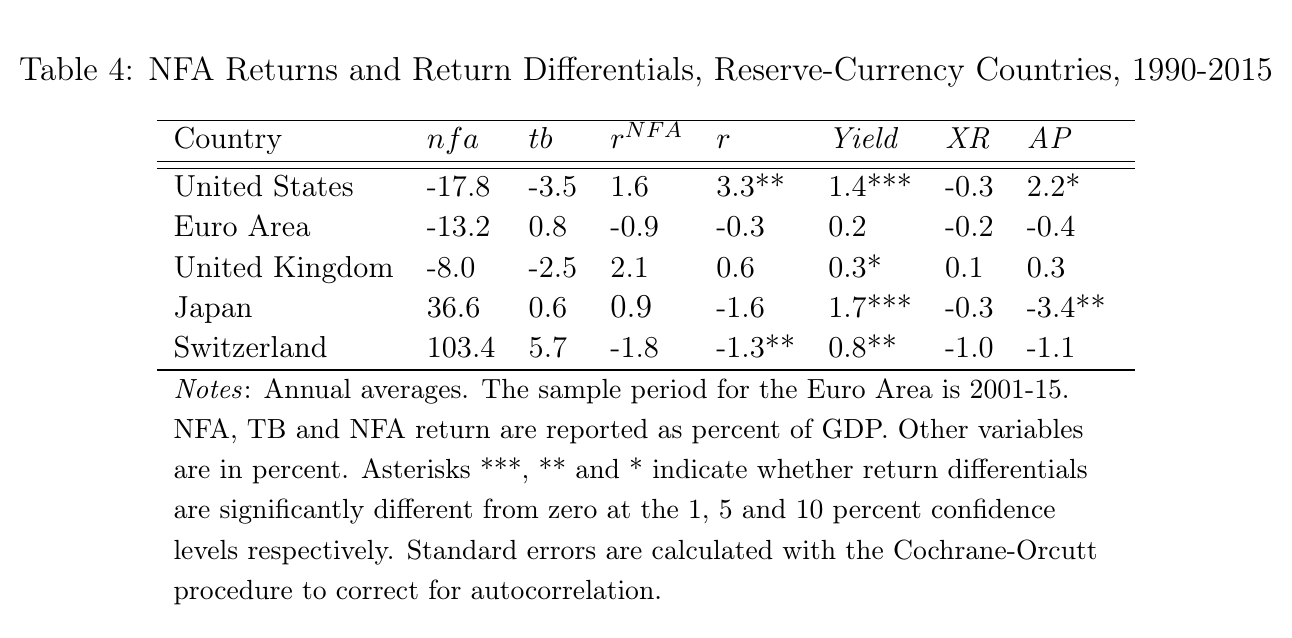
The United States is a net debtor at −17.8 percent of gdp and still earns +1.6 percent of gdp a year on its net position, with a return differential of 3.3 points, from both yields and asset prices. That is exorbitant privilege as an annual coupon. The uk has a differential of only 0.6 but earns 2.1 percent of gdp, because its gross positions are more than ten times gdp and a small gap on a huge base adds up. Japan shows why coupons aren’t the whole return: it has a 1.7-point yield advantage, more than wiped out by −3.4 in asset prices, for a −1.6 differential. Yet Japan still earns +0.9 percent of gdp, because it is a large creditor whose gross assets are mostly debt. Switzerland is the purest mercantilist: net assets of 103 percent of gdp, a 5.7 percent trade surplus, and a negative return of −1.8 percent of gdp. It saves a lot and loses some of it each year on prices.
What “stabilizing” means, precisely
The core regression (eq. 5 in the paper, p. 15) is:
where is or one of its components for country , is a country fixed effect, holds group interactions, and means that component pulls back when the stock is high. The fixed effect is doing important work and you should keep it in view. It absorbs whatever makes Switzerland always Switzerland, so is a common speed of reversion toward each country’s own level, , not toward zero. Every “higher nfa predicts lower X” below means higher than that country’s usual nfa.
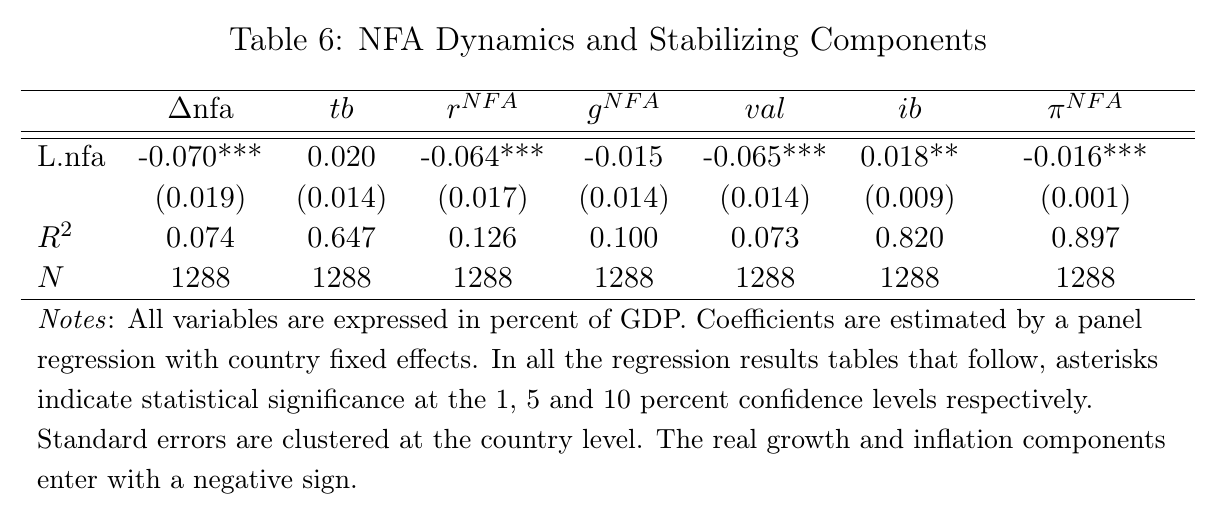
Δnfa loads at −0.070: stationary, but very slowly. Within a country, 10 points of gdp above its norm predicts a 0.7-point lower change next year (the paper calls it “a -0.7 percent change”, but with fixed effects it is a lower change, not necessarily a negative one). The trade balance shows no significant response in the baseline (0.020, standard error 0.014). The real nfa return does respond: −0.064, so 10 points of extra net wealth predicts about 0.6 percent of gdp less return next year. Valuation carries it at −0.065. Income is small and has the wrong sign. In the paper’s words, persistent trade imbalances push positions apart, and returns play “an important, although insufficient, stabilizing role.”
The surprising thing
Where does the drag come from? The obvious guess is that rich countries invest abroad badly. The data say that’s not it.
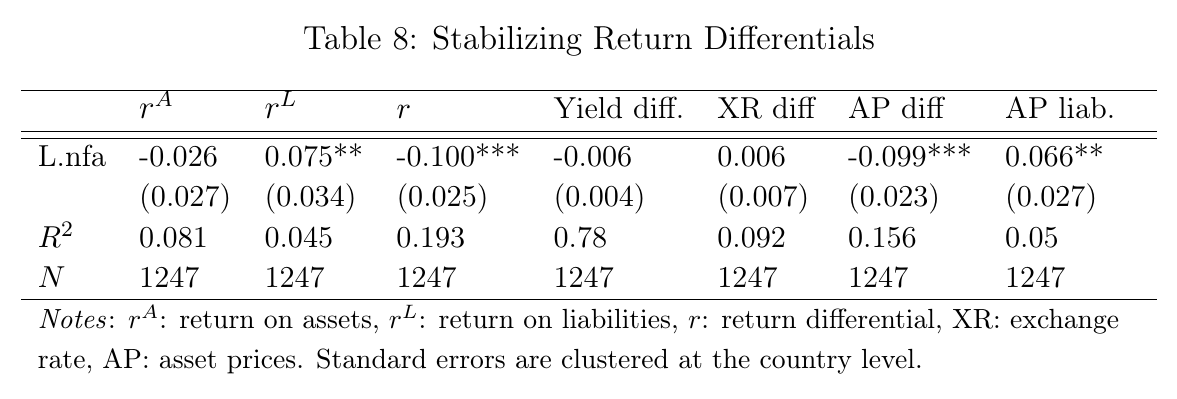
The return on foreign assets has no significant relationship with the position (−0.026). The return on liabilities does (+0.075), and the differential’s −0.100 is almost entirely its asset-price component, −0.099. So when a country gets richer abroad than usual, the domestic claims foreigners hold, mainly equities, go up in value, and that shows up as a loss on its external balance sheet. The paper’s footnote gives the reason: most countries are too small to move world asset prices but big enough to move their own. A striking result is that net valuation changes are therefore predictable from the position. That repeats Gourinchas and Rey’s us finding for 52 countries, and the footnote admits it “posed a significant challenge to the profession.” Two caveats from the paper itself. The −0.100 is called an upper bound, since it halves when the regression is unweighted. And it is a conditional slope; it does not say creditors earn negative returns.
Turn that around and it becomes insurance. A domestic slump lowers the value of the domestic claims foreigners hold, foreigners take part of the loss, and your net position improves. So an improvement in nfa is not automatically good news at home.
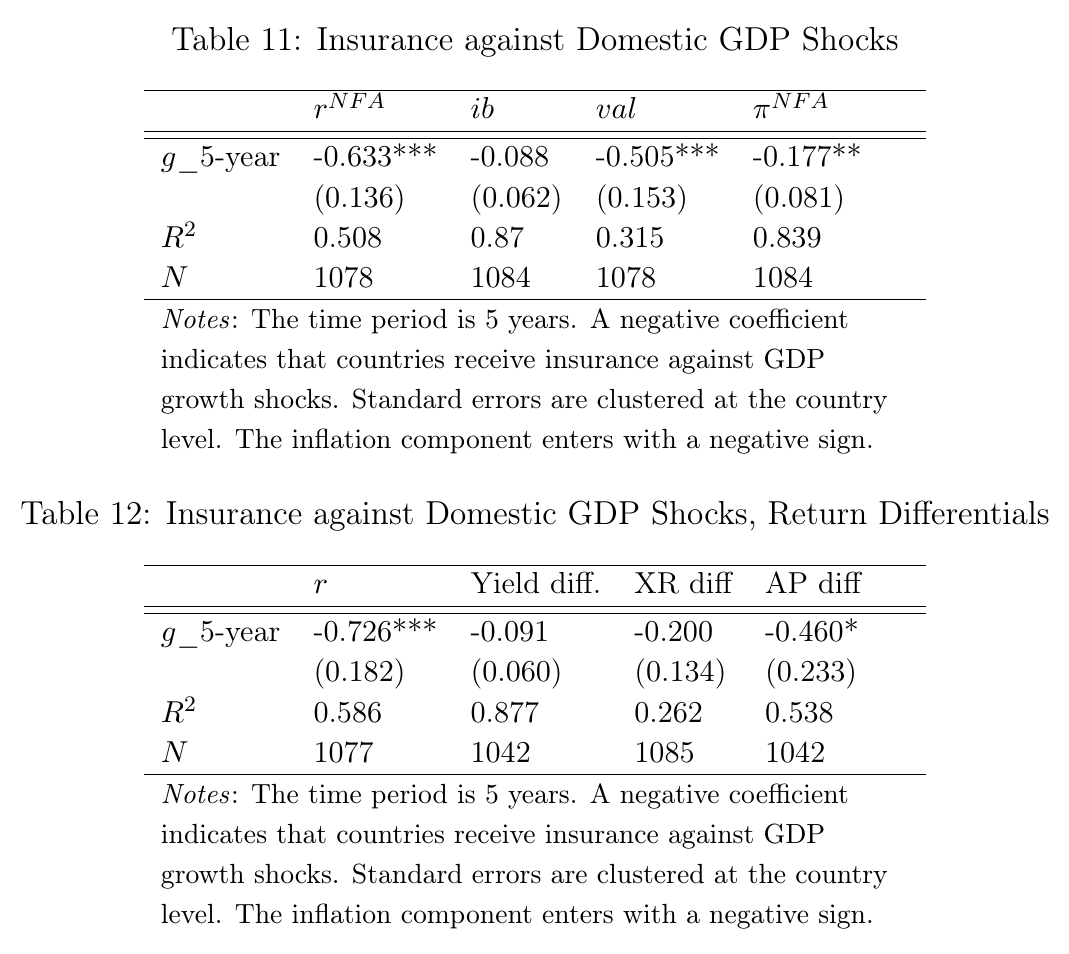
In five-year averages, 1 point lower domestic growth goes with about 0.6 percent of gdp higher nfa return (−0.633), mostly through valuation. In the differential, the asset-price gap is the largest piece (−0.460, significant only at 10 percent). The authors picked five-year windows because significance improves there. That is a sensible choice, but it measures how growth and returns move together on average, not the response to an identified shock.
The other side of the trade is the reserve issuers, who provide this insurance to the rest of the world.
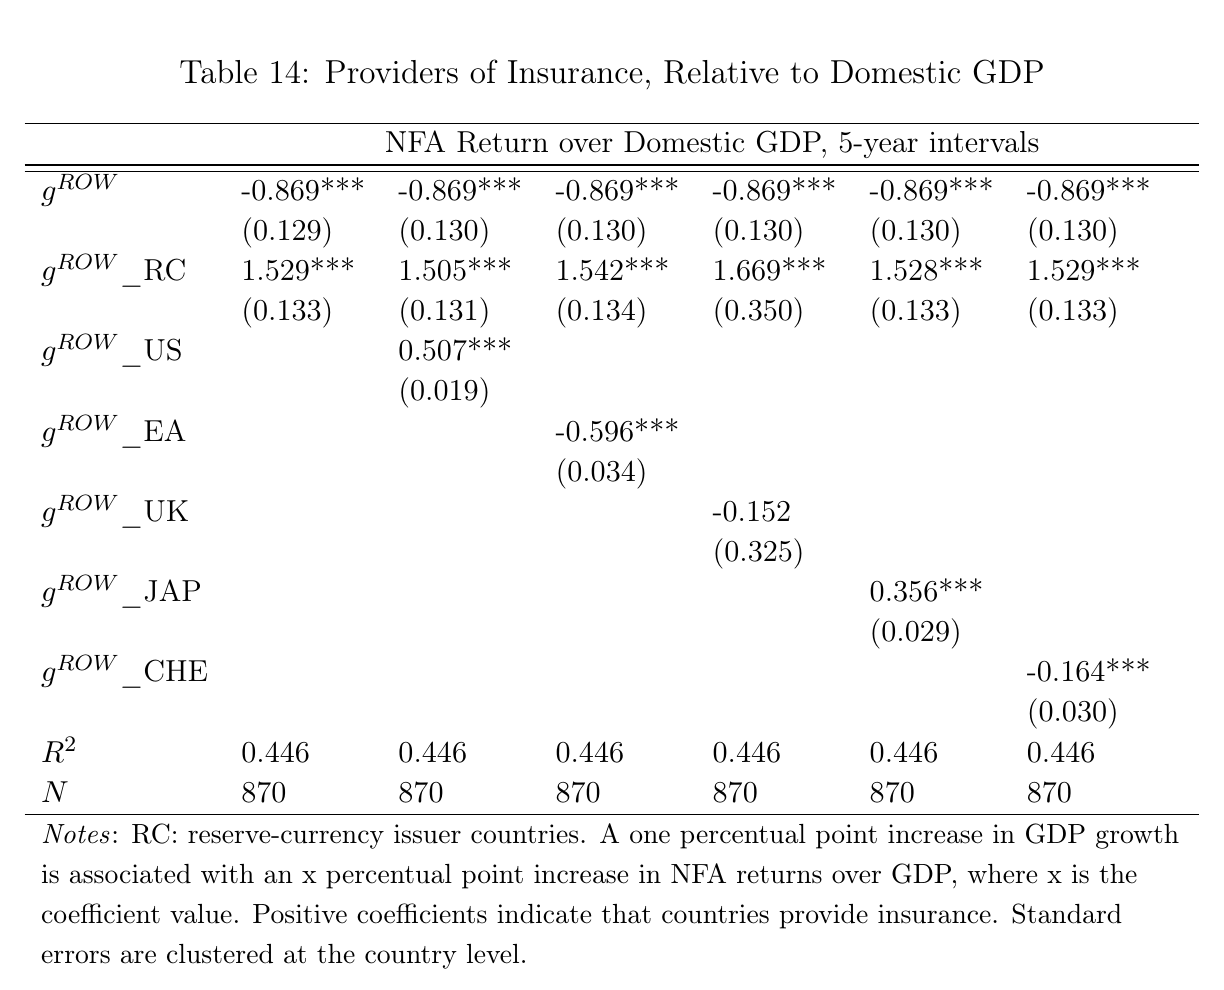
Pooled, a 1-point rest-of-world slowdown goes with reserve issuers’ nfa returns falling by about 0.66 percent of their own gdp (−0.869 + 1.529), which the paper rounds to “about 0.7” on average. These are wealth effects in five-year averages, not cash transfers.
There is also a timing result, which comes from the text rather than a table I show here. Emerging markets close half of an nfa gap in about 2.5 years, advanced economies in about 13. Reserve issuers take about 16 years against about 6 for others, but that difference is only significant at the 10 percent level. Creditor emerging markets adjust just as fast as debtor ones, so this isn’t only about debtors running into credit limits.
Limitations, as the paper states them
There is no structural model and no exogenous shock. The fixed-effects design gives within-country predictability, not causal effects, and the authors say plainly that causality in their cross-section can run either way. Valuation is a residual and the asset-price split is a residual of that; the confidential subsample supports the result without ruling the concern out. gdp weights let large economies dominate. Dropping the us keeps the return result, and so does the unweighted version, but the differential coefficient halves. Financial centres and profit-shifting blur the line between trade and income, and excluding them doesn’t change the result. The trade-balance non-result also depends on specification: adding its own lag gives a tiny significant negative coefficient, and imposing the accounting identity by sur gives a tiny significant positive one. “No significant response in the baseline” is the accurate summary. The paper also never says what eventually stabilizes positions if trade never adjusts and returns are “insufficient.”
Where the prose and the exhibits disagree
These are small mismatches, mostly between text and tables, and none of them changes the headline. Use the tables in each case. The prose about the steady-state chart says Singapore, Switzerland and Belgium are positions that “would narrow”, but in the chart all three have steady-state bars above their 2015 values, so they would widen. On Table 4, the text gives Japan a 1.2 percent return (the table says 0.9), gives Switzerland a −1.6 differential and an “overall small positive” return (the table says −1.3 and −1.8), and calls the us return “about a third” of its trade deficit (1.6/3.5 is closer to a half). The text says individual reserve issuers provide insurance “between 0.1 and 0.9” percent of own gdp, but adding up Table 14’s columns gives the us about 1.14 and Japan about 1.02. The country-insurance chart’s prose says the non-insured cases are statistically zero, yet Sweden’s band lies entirely above zero, so the insurance is widespread rather than universal. And the appendix text says “winsorize” and “5-year averages” where the table notes say observations were excluded and a 5-year lag was used.
The policy point is in footnote 3, almost as an aside. If you push your trade surplus up through policy, some of it comes back to the rest of the world as low returns on your net position, because your own stock market rises with your foreign wealth and foreigners own part of it. The net effect is that a mercantilist country saves a lot and pays some of the gain to the foreigners who hold its shares.