Notes on:
A Network Approach to Geopolitics
Working paper
2026
geoeconomics · networks · alliances · foreign influence
PDF · Transcript
Made with AI: Fable 5.1 (reading and writing)
Ernest Liu, Stephen Redding, Bennett Smith-Worthington and David Yang; discussed by Christopher Clayton. nber si International Economics and Geopolitics, July 16, 2026 (video 00:05–01:06). Written from the July 2026 draft of the paper; where the talk or the Q&A said something the draft does not, the text says so.
Geopolitics as a beauty contest
Here is a simple model of how a country decides what to do about, say, export controls on chips to China. It has its own view — call it its domestic interest, — and it would like to act on that view. But it also has friends, and it would like its action to sit close to theirs, because being out of step with your allies is expensive in ways that are hard to itemize and easy to feel. So it picks something in between: a weighted average of what it wants and what its neighbors are doing. Its neighbors are doing the same thing, so in equilibrium every country’s action is a weighted average of its own interest, its neighbors’ interests, its neighbors’ neighbors’ interests, and so on out through the graph. Economists call this a network beauty contest, after Keynes’s (1936) newspaper competition in which you win not by picking the prettiest face but by picking the face everyone else picks. It is a slightly unflattering name for foreign policy, but then foreign policy is a slightly unflattering activity.
The Liu–Redding–Smith-Worthington–Yang move is to put a stage in front of this. Before anyone acts, every country can spend to push every other country’s incentives up or down — a number that can be positive or negative, at a quadratic cost scaled by — which the paper calls strategic influence. Then everyone plays the beauty contest with the pushes baked in. The second-stage best response is (eq. 7 in the paper)
where is the weight on your own interest, is how much wants to line up with , and the last term is the net push you have received from everyone. Net influence simply shifts the interest you appear to have: the paper’s Lemma 1 says receiving is the same as having a domestic interest of , which is a tidy way to say that pressure works by changing what you seem to want.
The interesting first-order condition is the one for the pushes (eq. 11):
Read it from the right. Country pushes country harder when the neighbors that cares about () are acting out of line with (the gap ), and when those neighbors are moved by (the entry, which counts every direct and indirect path from to ). Liu’s version at the podium: I want to influence Steve more if my neighbors act out of line with me and those neighbors listen to Steve. The Philippines might lobby Washington not because Manila cares about coordinating with Washington but because Manila cares about coordinating with Beijing and Beijing coordinates with Washington. The envelope theorem kills the term for your own action, since you chose it optimally; the last term is self-influence, , which the paper allows and which Clayton, in his discussion, renamed defensive statecraft — spending to entrench your own stance rather than to move someone else’s. Everything is linear-quadratic, so the whole thing solves with pen and paper (Clayton got a fair way down that road on his slides before, in his words, deciding to stop), and the answer is a matrix, , where depends on the network and on how expensive influence is.
Two limits and one accounting identity are worth carrying around. Make influence infinitely expensive and you are back in the plain beauty contest. Make it as cheap as the model allows — has to stay above for the problem to be concave, so influence is never actually free — and every country’s action converges to the plain average of everyone’s interests (the size-weighted average, once the network is asymmetric). Cheap influence homogenizes the world, which is an interesting thing to say out loud at a conference about fragmentation. And the equilibrium is what the paper calls conservative: the average action equals the average interest, and net influence sums to zero across countries. Strategic pressure moves incentives around; it does not, in the paper’s phrase, create net persuasion out of thin air. Every push someone receives is a push someone else paid for.
The cleavage trick
The payoff of the linear structure is a spectral decomposition, and this is the part of the paper that is genuinely elegant rather than merely tidy. Any international issue is a vector of country interests. The eigenvectors of form a basis for such vectors, and Proposition 3 says what each eigenvector is: the first is a constant (everyone agrees), and each subsequent one is the pattern of disagreement that, among patterns orthogonal to the earlier ones, minimizes disagreement between network neighbors. So the eigenvectors are cleavages — the East–West divide, a North–South divide, India against Pakistan — ordered from the one that splits the world most cleanly along its friendships to the ones that cut across them. A new issue (China contemplating Taiwan, say) is some linear combination of cleavages, and Proposition 4 says the equilibrium actions are the same linear combination, except that each cleavage is scaled by a number that depends only on its eigenvalue:
with between zero and one and increasing in ; here and are the coordinates of interests and actions on the -th eigenvector. The paper calls this spectral decoupling: nothing spills from one cleavage into another. High-eigenvalue cleavages are ones where neighbors agree and the disagreement sits between weakly connected blocs — the United States with Canada and Europe on one side, China with Russia and Iran on the other — and there coordination amplifies: everyone lines up with friends who already agree, and you get what the paper calls a geopolitical echo chamber. Low-eigenvalue cleavages are ones where neighbors disagree, the United States and France, say, and there coordination suppresses. Cheaper influence attenuates the low-eigenvalue cleavages first; as approaches its floor only the consensus mode survives. This is the paper’s one-line theory of why some quarrels become cold wars and others become communiqués.
The paper builds two things on top of this that the talk had no time for. One is a contestability index: for each country, one minus the cosine similarity between the vector of foreign pushes it receives and a vector of ones. Zero means monolithic pressure, everyone shoving you the same way; one means a tug-of-war in which the pushes cancel exactly and you are, in the paper’s words, a swing state or a battleground. On a four-node toy network (United States, eu, a Global South, China) the Global South is a perfect battleground on the us-and-eu-versus-China cleavage, is under monolithic pressure on the cleavage where China sides with the West against it, and — the nice one — on a pure us–eu split everyone else becomes a battleground, because Washington and Brussels pull the rest of the world in opposite directions and cancel abroad. The other is welfare: under the paper’s identifying assumption, expected payoffs are additive across cleavages, so you can price each fault line separately and add. The United States can be central on the us–Soviet axis and peripheral on India–Pakistan at the same time, and the welfare arithmetic keeps the two apart.
Finding the network without asking anyone
Where does come from? The obvious answer — declare it to be Nato membership, or bilateral trade — is the one the authors decline. They recover it from revealed preference. Countries act on many issues; their interests covary across issues, and so do their actions. If Ernest and Steve have very similar interests but always act in opposite ways, they cannot be strongly connected. If Ernest and Jesse have opposite interests but always act alike, they must be connected, directly or indirectly. (The examples are Liu’s, from the talk.) The assumption that makes this work is what the paper calls graph stationarity: the covariance matrix of interests shares ’s eigenvectors, so the cleavages that organize who listens to whom are also the cleavages along which interests happen to vary. It sounds like a lot to assume. The paper’s Remark 1 argues it is less than it sounds: within the model, stationarity is not only sufficient but generically necessary for the interest and action covariances to share principal components, so it imposes nothing on the data beyond that shared-components property, which you can go and look at. Under it, Proposition 5 gives identification cleavage by cleavage: the ratio of action variance to interest variance along eigenvector is , so invert and you have the eigenvalue. A cleavage along which interests never vary is unidentified, but harmlessly so, since by decoupling it never touches the ones you can see.
The data are more specific than “un votes and V-Dem.” Actions are the Bailey–Strezhnev–Voeten (2017) ideal points estimated from un General Assembly voting on six topic categories (human rights, nuclear, Middle East, disarmament, colonialism, economic), demeaned by a size-weighted world average and covaried within each decade; resolution-level votes enter only when the model is inverted to back out implied influence, for the calibration of the asymmetry and for the state-visit check below. Interests are 33 V-Dem (Coppedge et al. 2011) indices of domestic institutions out of the 48 available, the 33 being the ones a Lasso selects as predictive of differences in un ideal points — civil liberties, judicial constraints on the executive, women’s political participation, corruption, and so on. The two covariance matrices are then approximately jointly diagonalized, decade by decade, in Flury’s (1984) common-principal-components sense: find the one orthonormal basis that comes closest to diagonalizing both at once. The result is strongly low-dimensional. Five components reproduce over 95 percent of the uncentered second moments and over 77 percent of the covariances, which is the paper’s way of saying the world runs on a handful of cleavages. The scale parameters are set rather than estimated, and , and the eigenvalues are only identified up to units anyway, so they are normalized so that the top non-consensus eigenvalue sits just below the consensus one. None of that touches the counterfactuals, which are reported in the units of the data.
Symmetry is broken by a structural-importance vector . The directed network is for a symmetric , so that — the United States matters more to Peru than Peru to the United States — and influence costs scale with , so pushing upward is expensive and pushing from the periphery is expensive. Liu called this quasi-symmetry in the Q&A: a symmetric graph with one vector carrying all the asymmetry, and everything above goes through in -weighted coordinates. They set to gdp to the power 0.78, the exponent chosen so that the model’s regression of log outward-over-inward influence on log gdp matches the slope in the fbic (Moyer, Meisel, and Szymanski-Burgos 2024) bilateral-influence data, 0.701.
What the network looks like
The dominant cleavage — the second eigenvector, the first being consensus — is mapped decade by decade in Figure 4, and the story it tells is more interesting than the one the talk told.
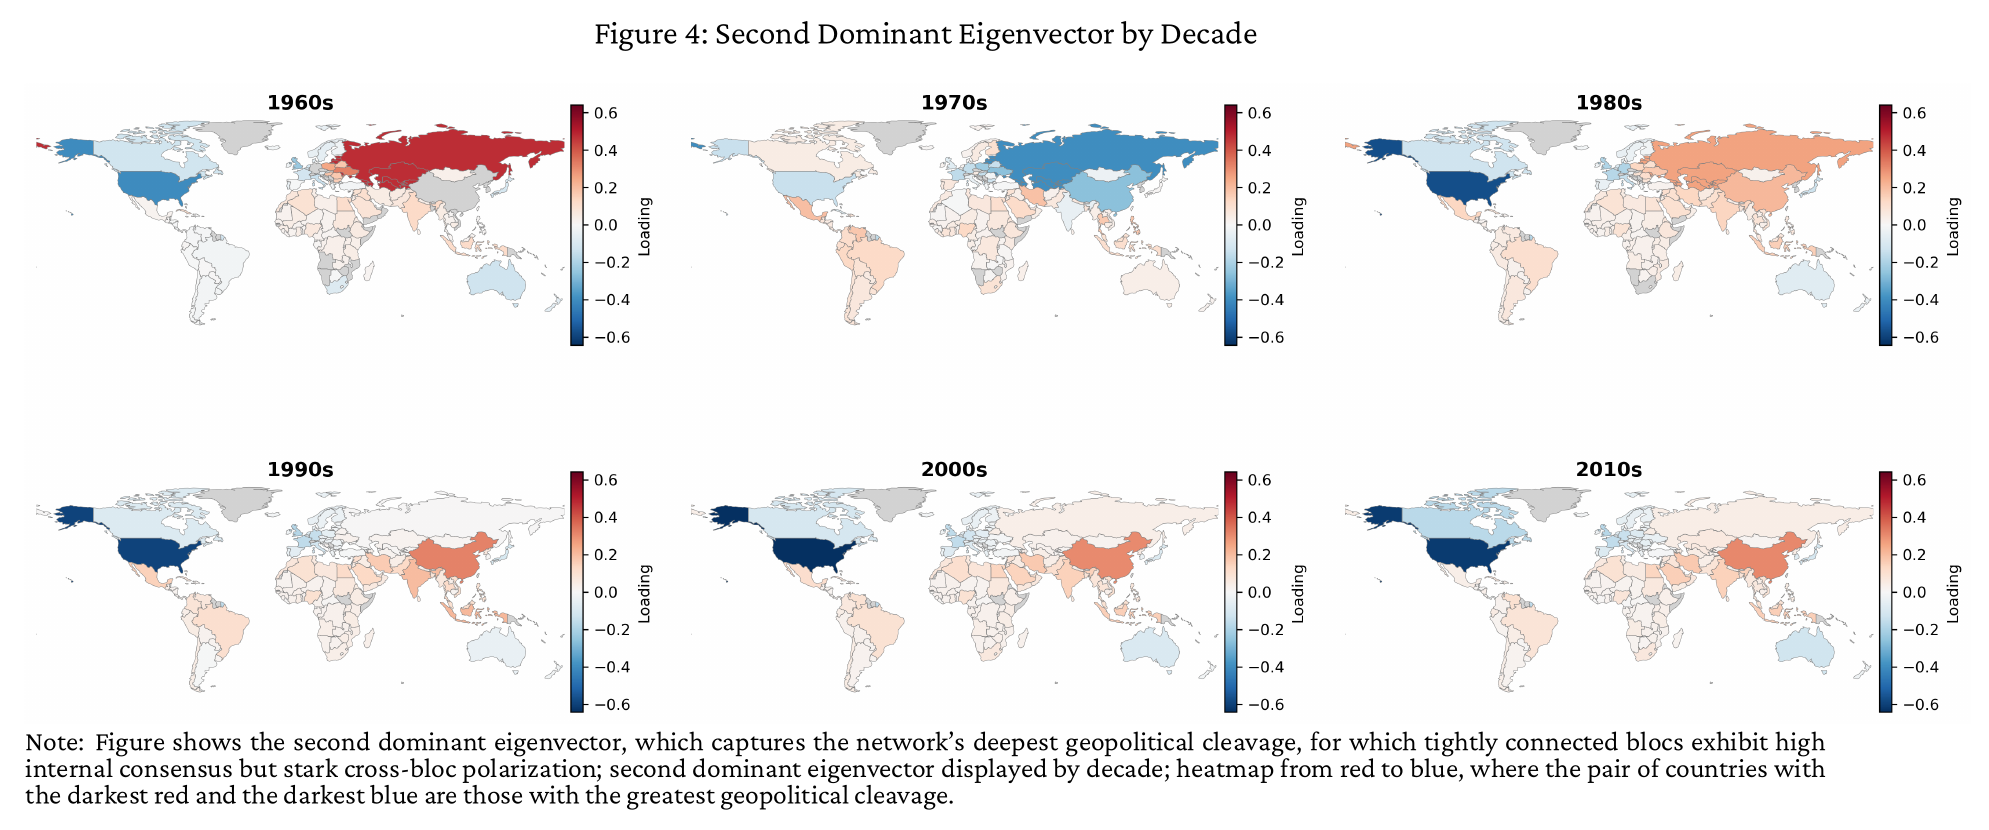
In the 1960s it is the Cold War, the United States and its allies against the Soviet bloc. In the 1980s it is the Cold War again. Since the 1990s it is the United States and Western Europe on one pole, China on the other, and much of the Global South in between. The 1970s are the odd decade, and here the talk and the paper diverge. Liu’s gloss from the podium was that détente demoted the East–West divide to the second-most-important cleavage. The paper says something different and better: in the 1970s the dominant cleavage becomes a divide between the major powers — the United States and the Soviet Union together — and the developing world, reflecting the rising political salience of the Third World. And China loads with the major powers, not with the developing world it was at that time loudly claiming to lead. The eigenvector did not get the memo. The 1990s panel also shows Poland and the Czech Republic moving toward the Western pole, and the former Soviet bloc no longer anchoring the extreme position it held during the Cold War. An appendix adds that security dependence dominated the network’s relationship to outside proxies in the early Cold War decades and economic dependence overtook it from the 1980s on.
The network is otherwise persistent. Correlating each country’s outward links across successive decades, the average is typically 0.69 or higher, with one exception: from the 1980s to the 1990s it falls to 0.59, with a bulge of countries near zero or negative — the Iron Curtain, showing up as a trend break. And the network is asymmetric in the way you would expect, only more so. Figure 5 maps the United States and China in the 2010s, outward (how much they care about others) and inward (how much others care about them). Note that “who weights the United States heavily” is a column of , not a row, since is how much cares about .
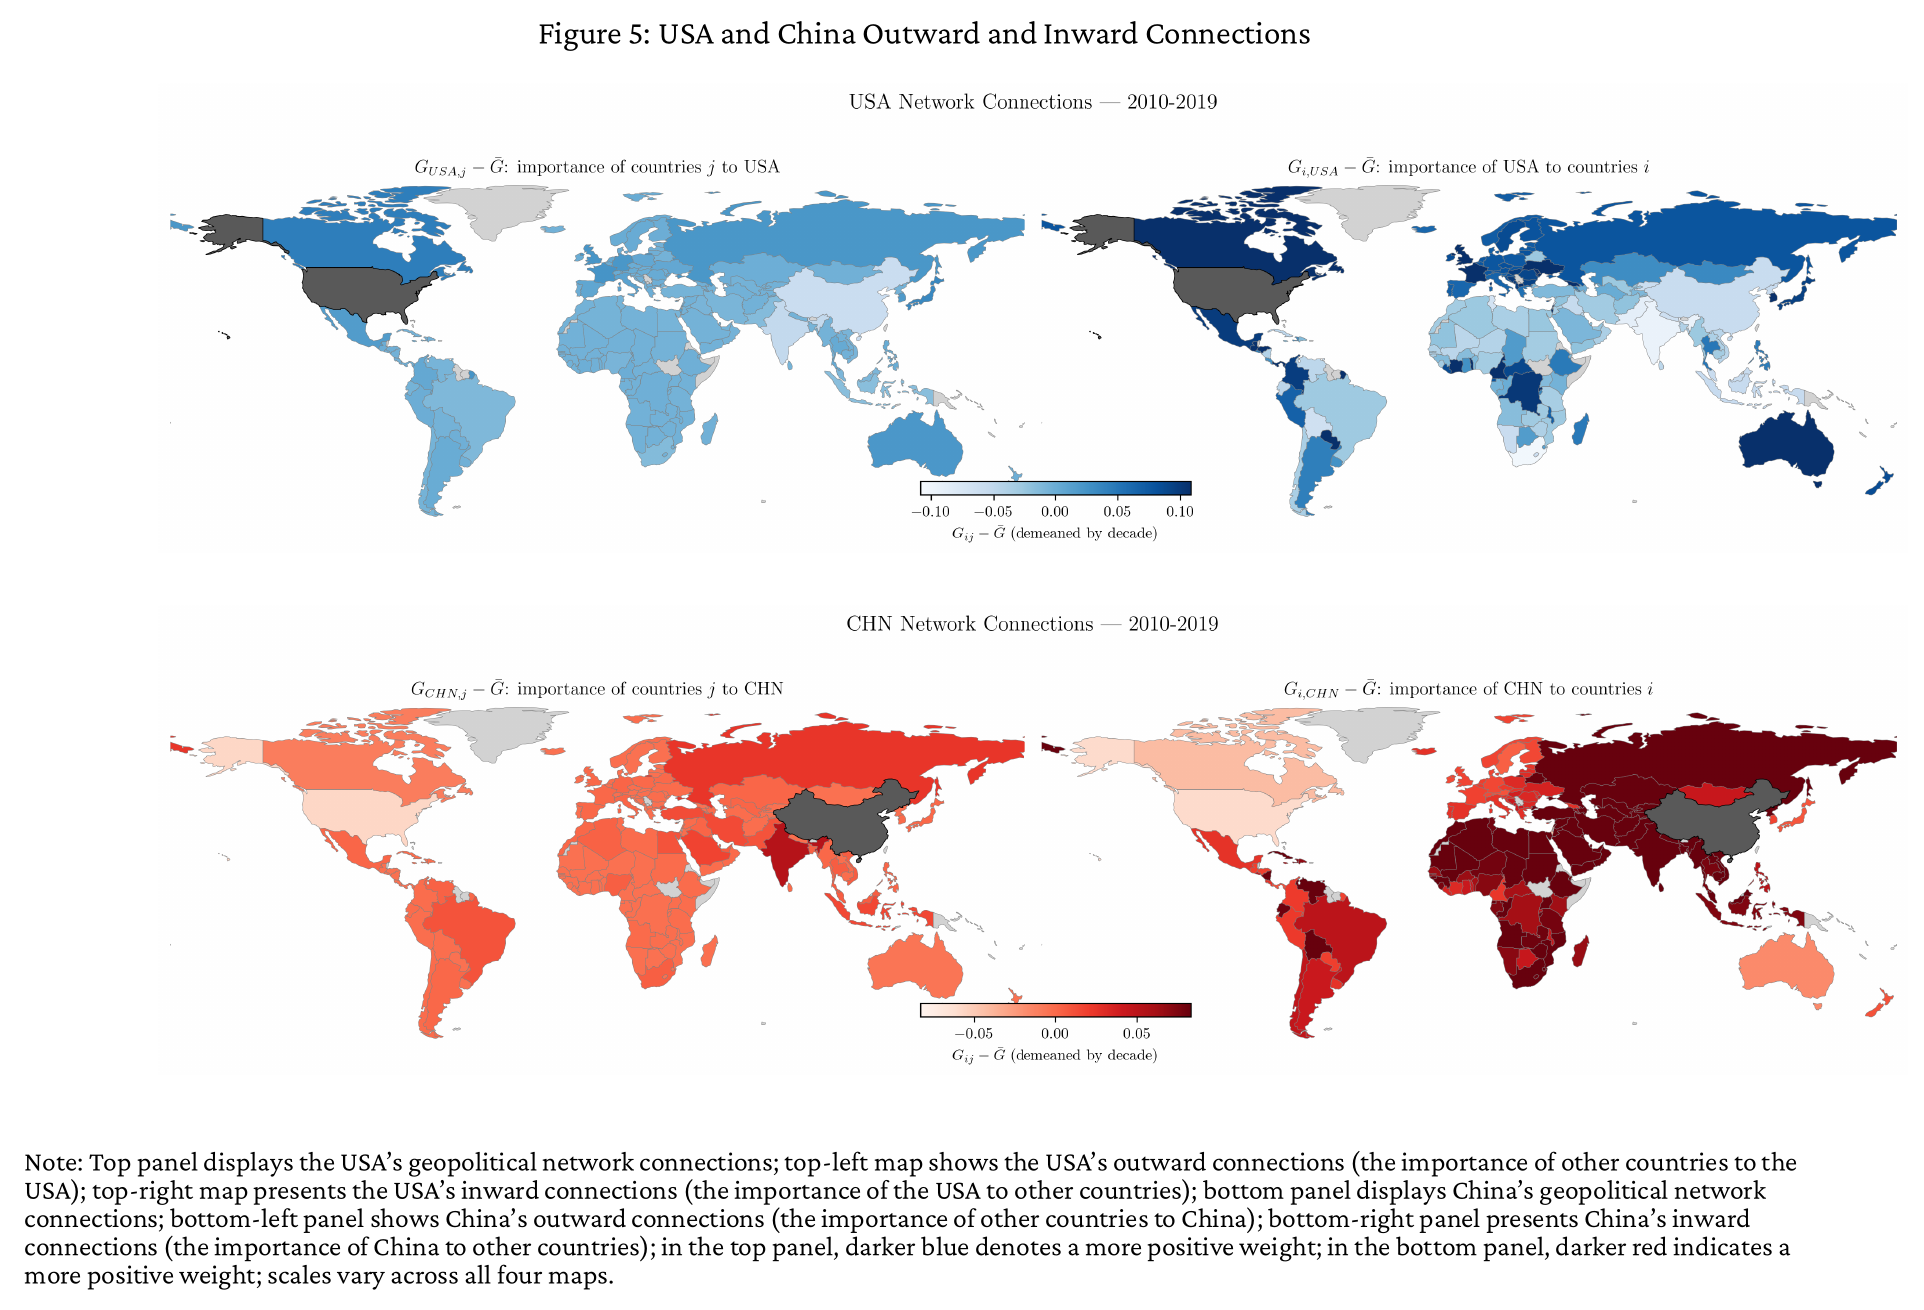
The United States is strongest to Canada and Western Europe (Japan and Australia are dark on the inward map too, which is what the talk listed); China’s strongest links are in Asia and to Russia, North Korea and India, countries with which the United States has weak links. The one-sided relationships are the fun part: the United States cares relatively more about China than China cares about the United States, New Zealand weights the United States more than the reverse, and many African countries care more about China than China cares about them. And the range of other countries’ weights on the United States is an order of magnitude larger than the range of the United States’ weights on them, which is what structural importance means in practice.
Does any of this correspond to anything you could have measured directly? Table 2 regresses each recovered link on the usual proxies, with sender-decade and receiver-decade fixed effects and everything standardized.
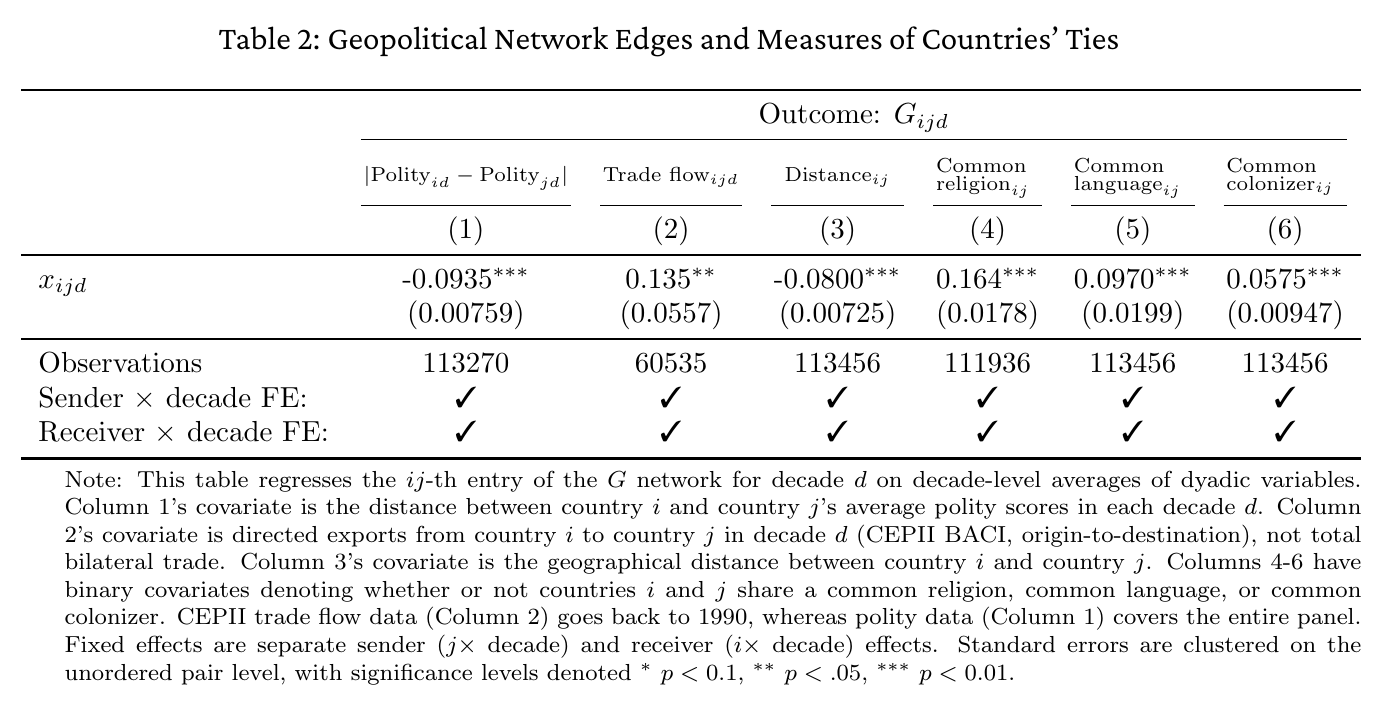
Institutional distance and geography lower a link; trade, religion, language and a shared colonizer raise it. The paper’s argument that this is not mechanical is fair: a link is a size-weighted sum over five eigenvectors of products of their entries times an inverted scaling function, and there is no obvious reason that object should line up with gravity variables. Two placebos say it lines up for the right reasons: scramble the country labels before estimating and the coefficients vanish; replace the discarded residual variation with noise of the same size, re-estimate, and they do not move.
The validation I found most persuasive uses data the estimation never touches. Take each year’s un resolution votes as actions, invert to get that year’s implied interests, feed those into the influence first-order condition to get a matrix of implied bilateral pushes, take absolute values, average both directions within a pair, and ask whether the pairs the model says are pushing on each other are the pairs whose leaders visit each other.
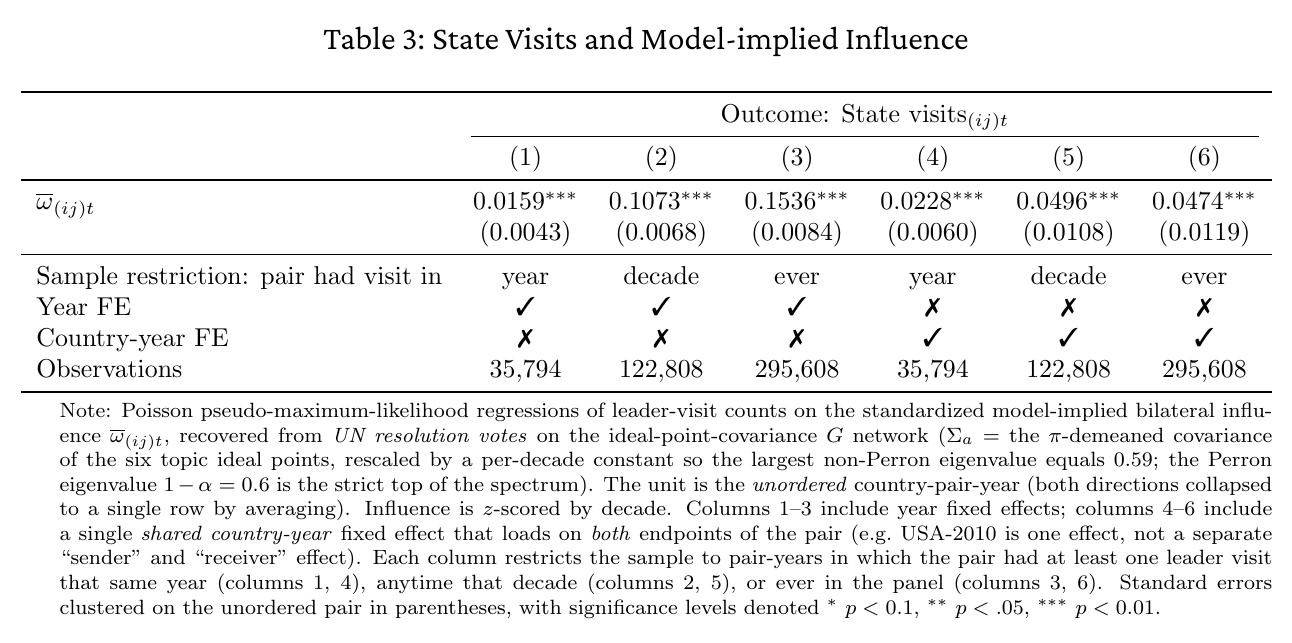
They are. With a shared country-year fixed effect — so that 2010 being a busy year for American diplomacy is absorbed — a one-standard-deviation increase in model-implied influence within a pair goes with roughly two to five percent more leader visits, depending on whether the sample is pairs that visited that year, that decade or ever. Liu rounded this to “roughly five percent” at the talk, which is the decade and ever columns; the annual column is closer to two. The cross-sectional versions without country-year effects are larger, with the coefficient rising to 0.15, and the paper is candid that those may partly be big countries having more visits for reasons outside the model.
How much of influence goes around rather than through
Because the model has an explicit first-order condition, it can split every push into the part that goes straight from to and the part that goes through ’s neighbors, their neighbors, and so on. Draw a thousand issues from the estimated interest covariance for each decade, solve, and average the indirect share.
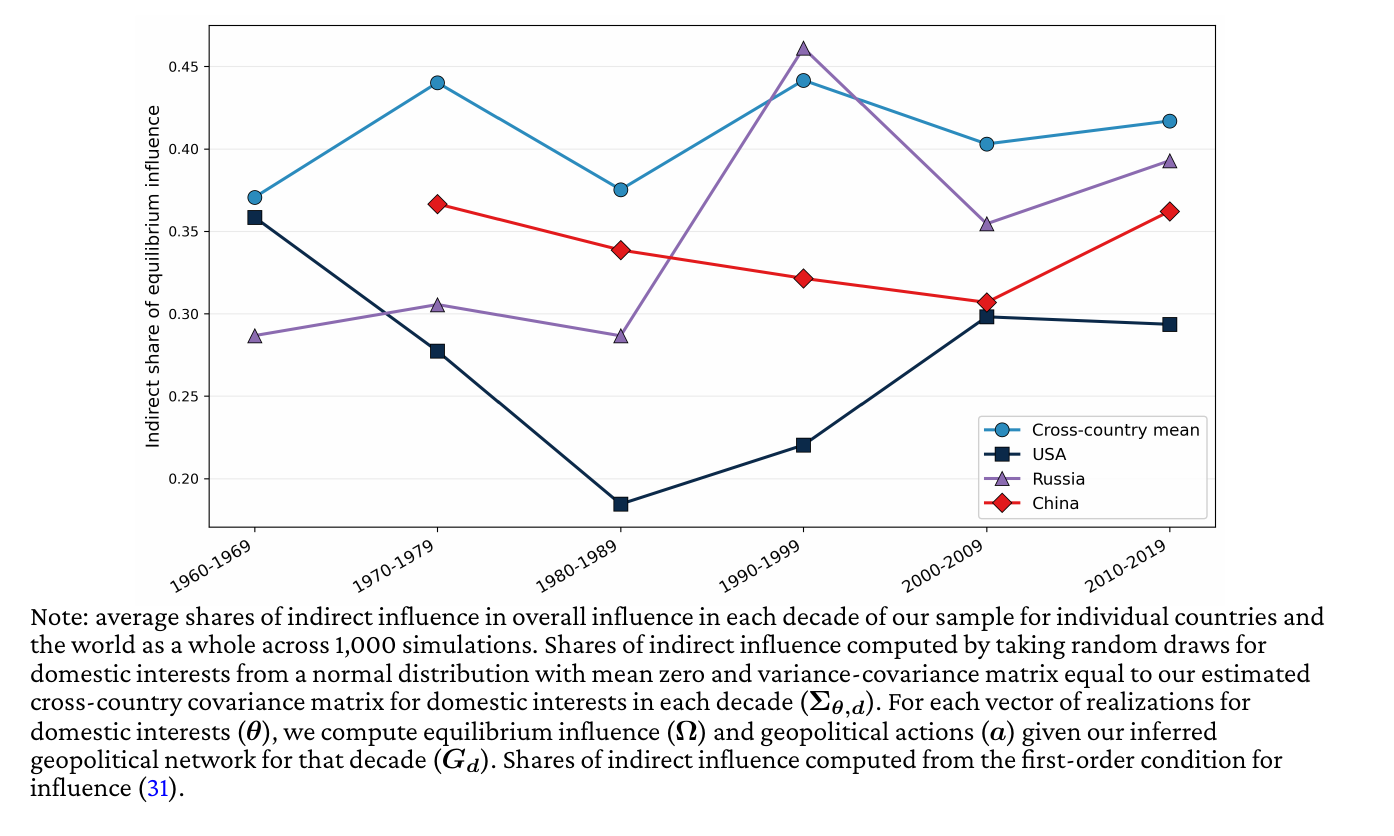
The text says the world’s average indirect share is around 45 percent and the United States’ and China’s around 35, with Russia starting like the United States and ending like the world, and with most series rising over time — more of influence going around as the network thickens. At the talk the number was 40. The figure itself plots the cross-country mean between 0.37 and 0.44 and the United States between 0.18 and 0.36, so the text is rounding up rather than reading off, and the honest summary is roughly forty percent for the world and something like a third for the superpowers. The direction is not in doubt: hegemons can do more of their pushing directly because they are directly connected to nearly everyone, and small countries live on the cascade. That is also the paper’s answer to whether you needed a network at all.
The counterfactuals, which are the point
Take the dominant cleavage of the 2010s network as the issue and set China’s domestic interest equal to the United States’, holding everyone else fixed. This is the Fukuyama (1992) experiment, the paper says, or the one Western policymakers ran in their heads for two decades: what if growth had made China want what America wants?
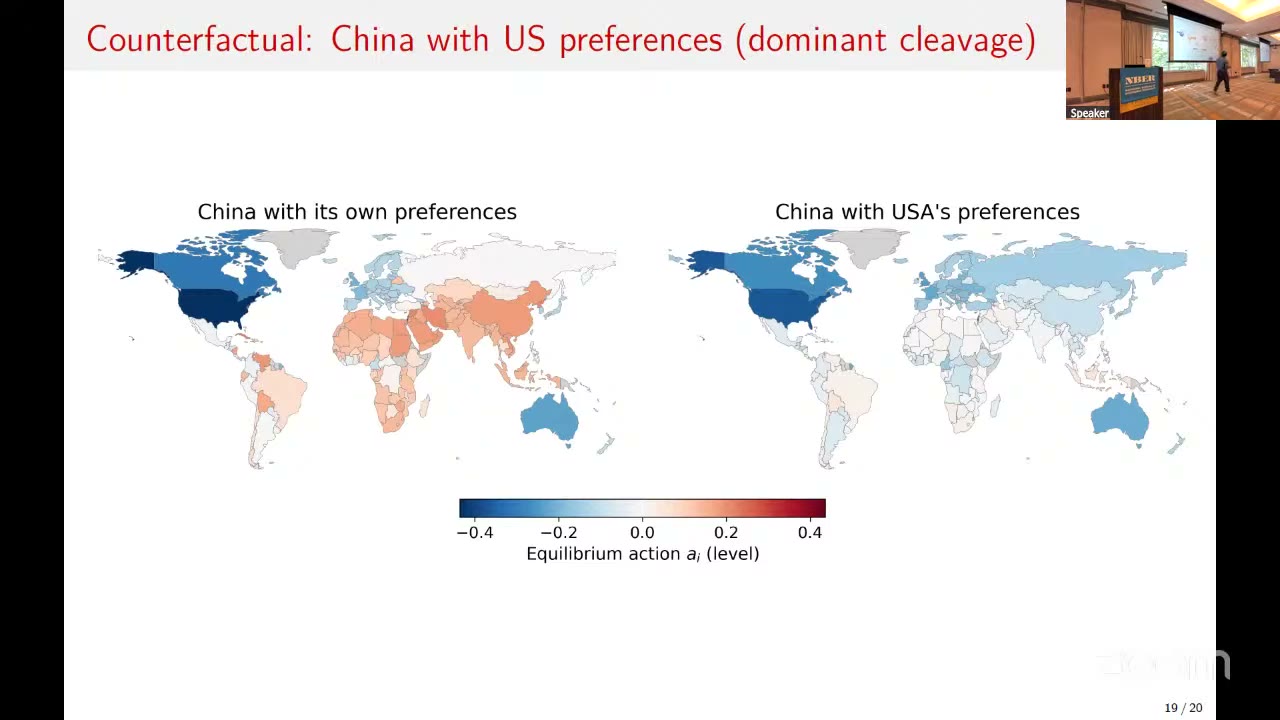
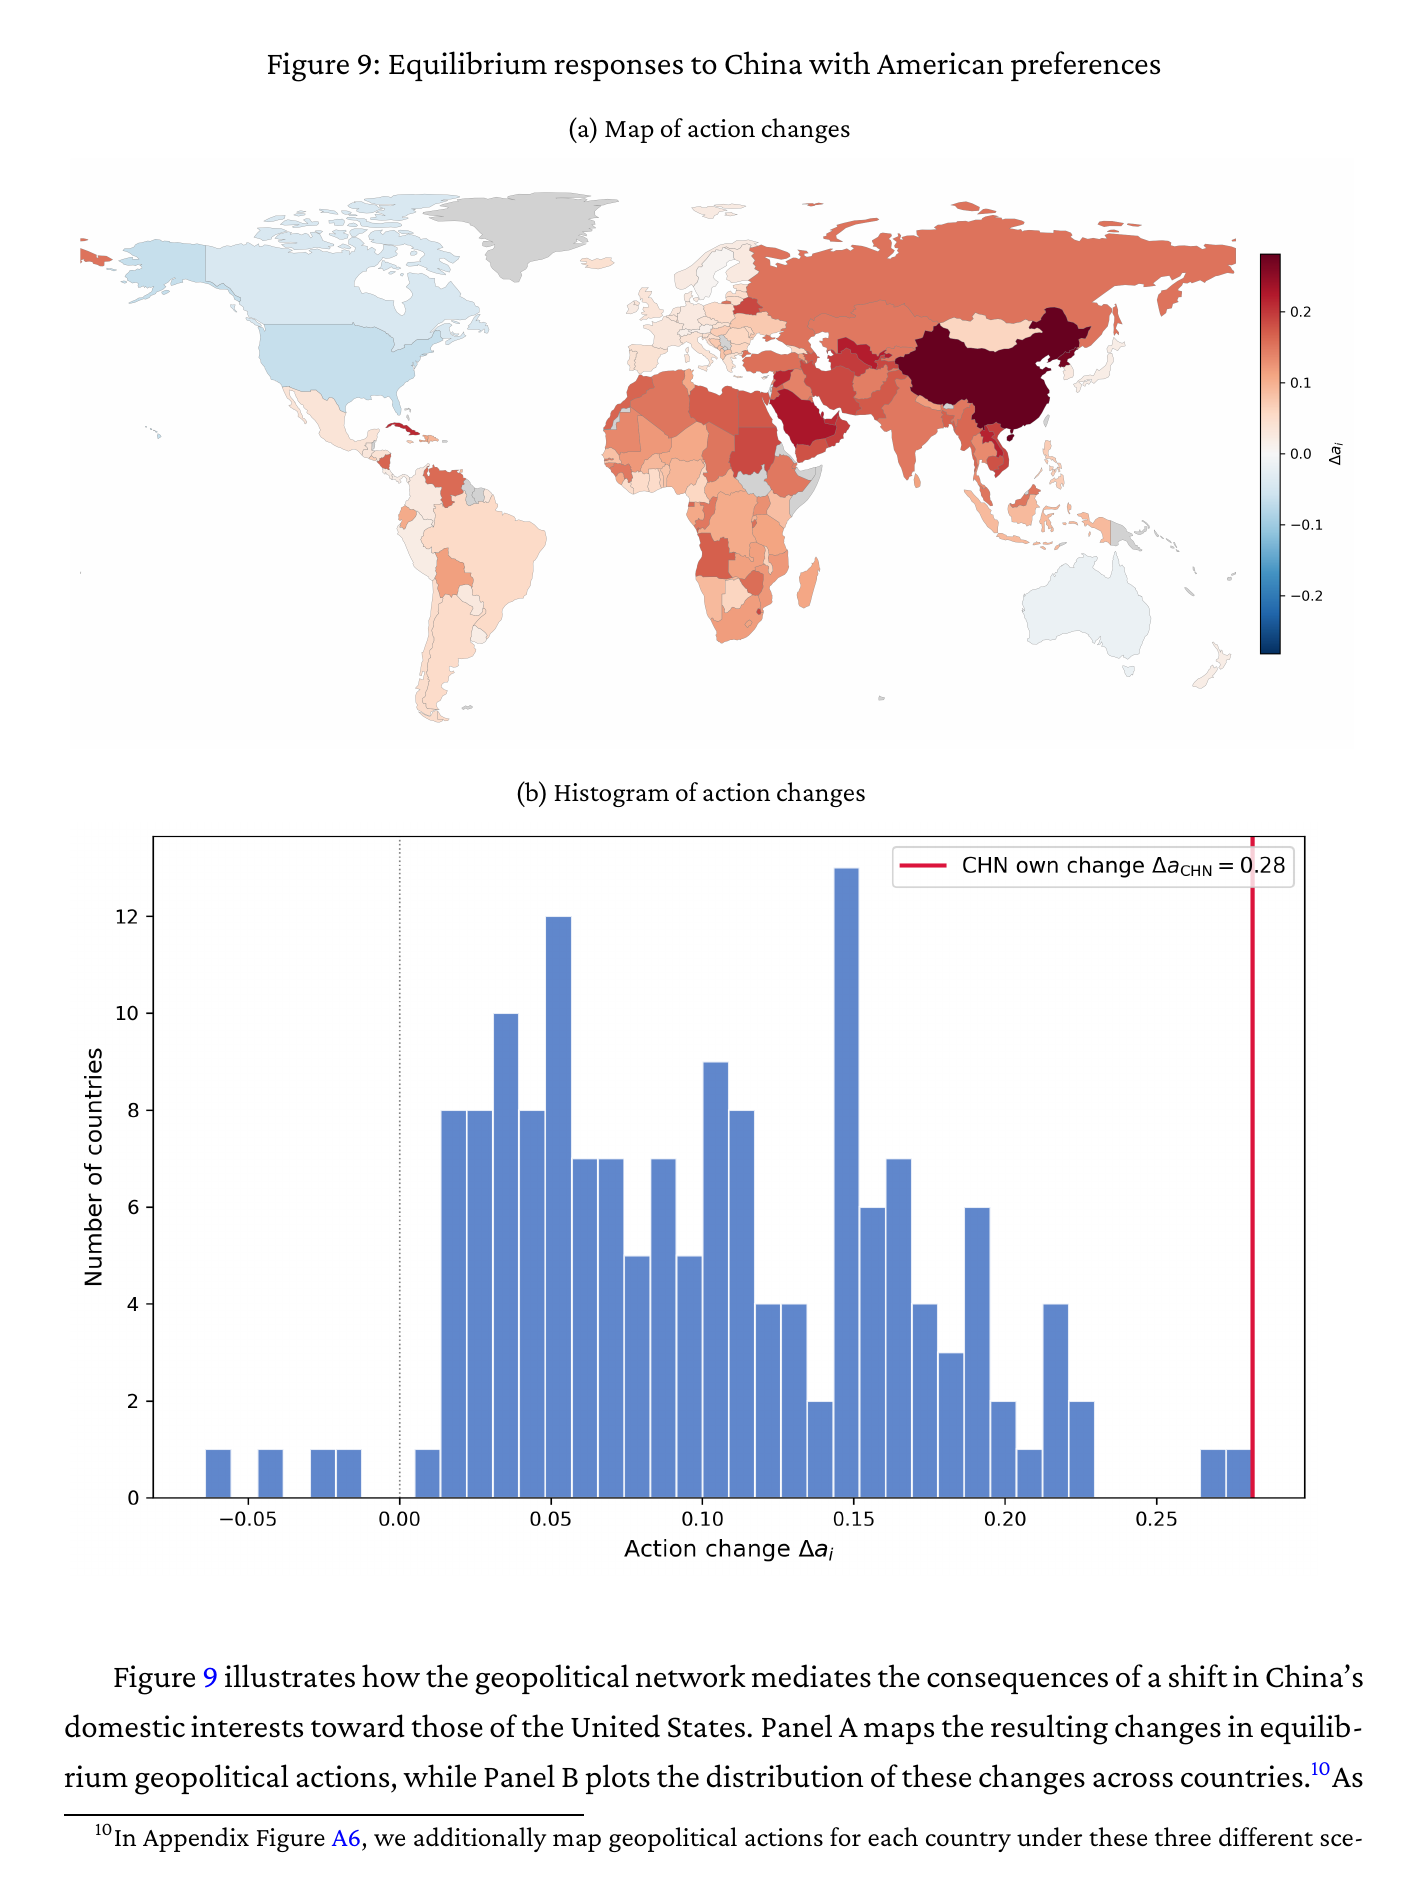
Three things happen. China’s own action moves a lot — 0.28 in the units of the data, more than any other country — but not all the way to the American action, because China is still coordinating with partners whose interests have not moved; the paper names Russia, India and other regional powers. (Liu said Russia and Iran at the talk; the draft says Russia and India.) Many of those partners move toward the United States too, without any change in their own interests — the largest adjustments are in Russia, Central Asia, the Middle East and parts of Africa — and the paper’s summary is that many countries act less like America not because their interests require it but because their positions are shaped by coordination with China. And then there are four countries that move the other way, slightly toward China: the United States and three of its closest allies, Canada, Israel and Australia. The paper’s explanation is general-equilibrium coordination. With China and its partners now closer to the American position, the United States and its inner circle have stronger incentives to coordinate with the rest of the network, and their own actions moderate. Liu’s spoken version — there is less need to take an extreme action and to influence others — is the same effect told from the influence side. Either way a China that converges reduces dispersion from both ends, and the model says so without being asked. The appendix runs the mirror image, American interests converging to China’s, and there the moderating effect is substantially stronger and reaches a much larger set of countries, which the paper attributes to the broader reach of American indirect connections. If you wanted a one-line summary of the difference between the two superpowers’ networks, that is not a bad one.
The second counterfactual is about power, and the paper is careful to say there are two kinds. Shock one country’s interest by one unit on the dominant cleavage, hold everyone else fixed, and measure how much that country’s own action moves, and how much everyone else’s actions move in total. The paper calls these autonomy and influence; Liu called them the freedom to express yourself and the ability to project.
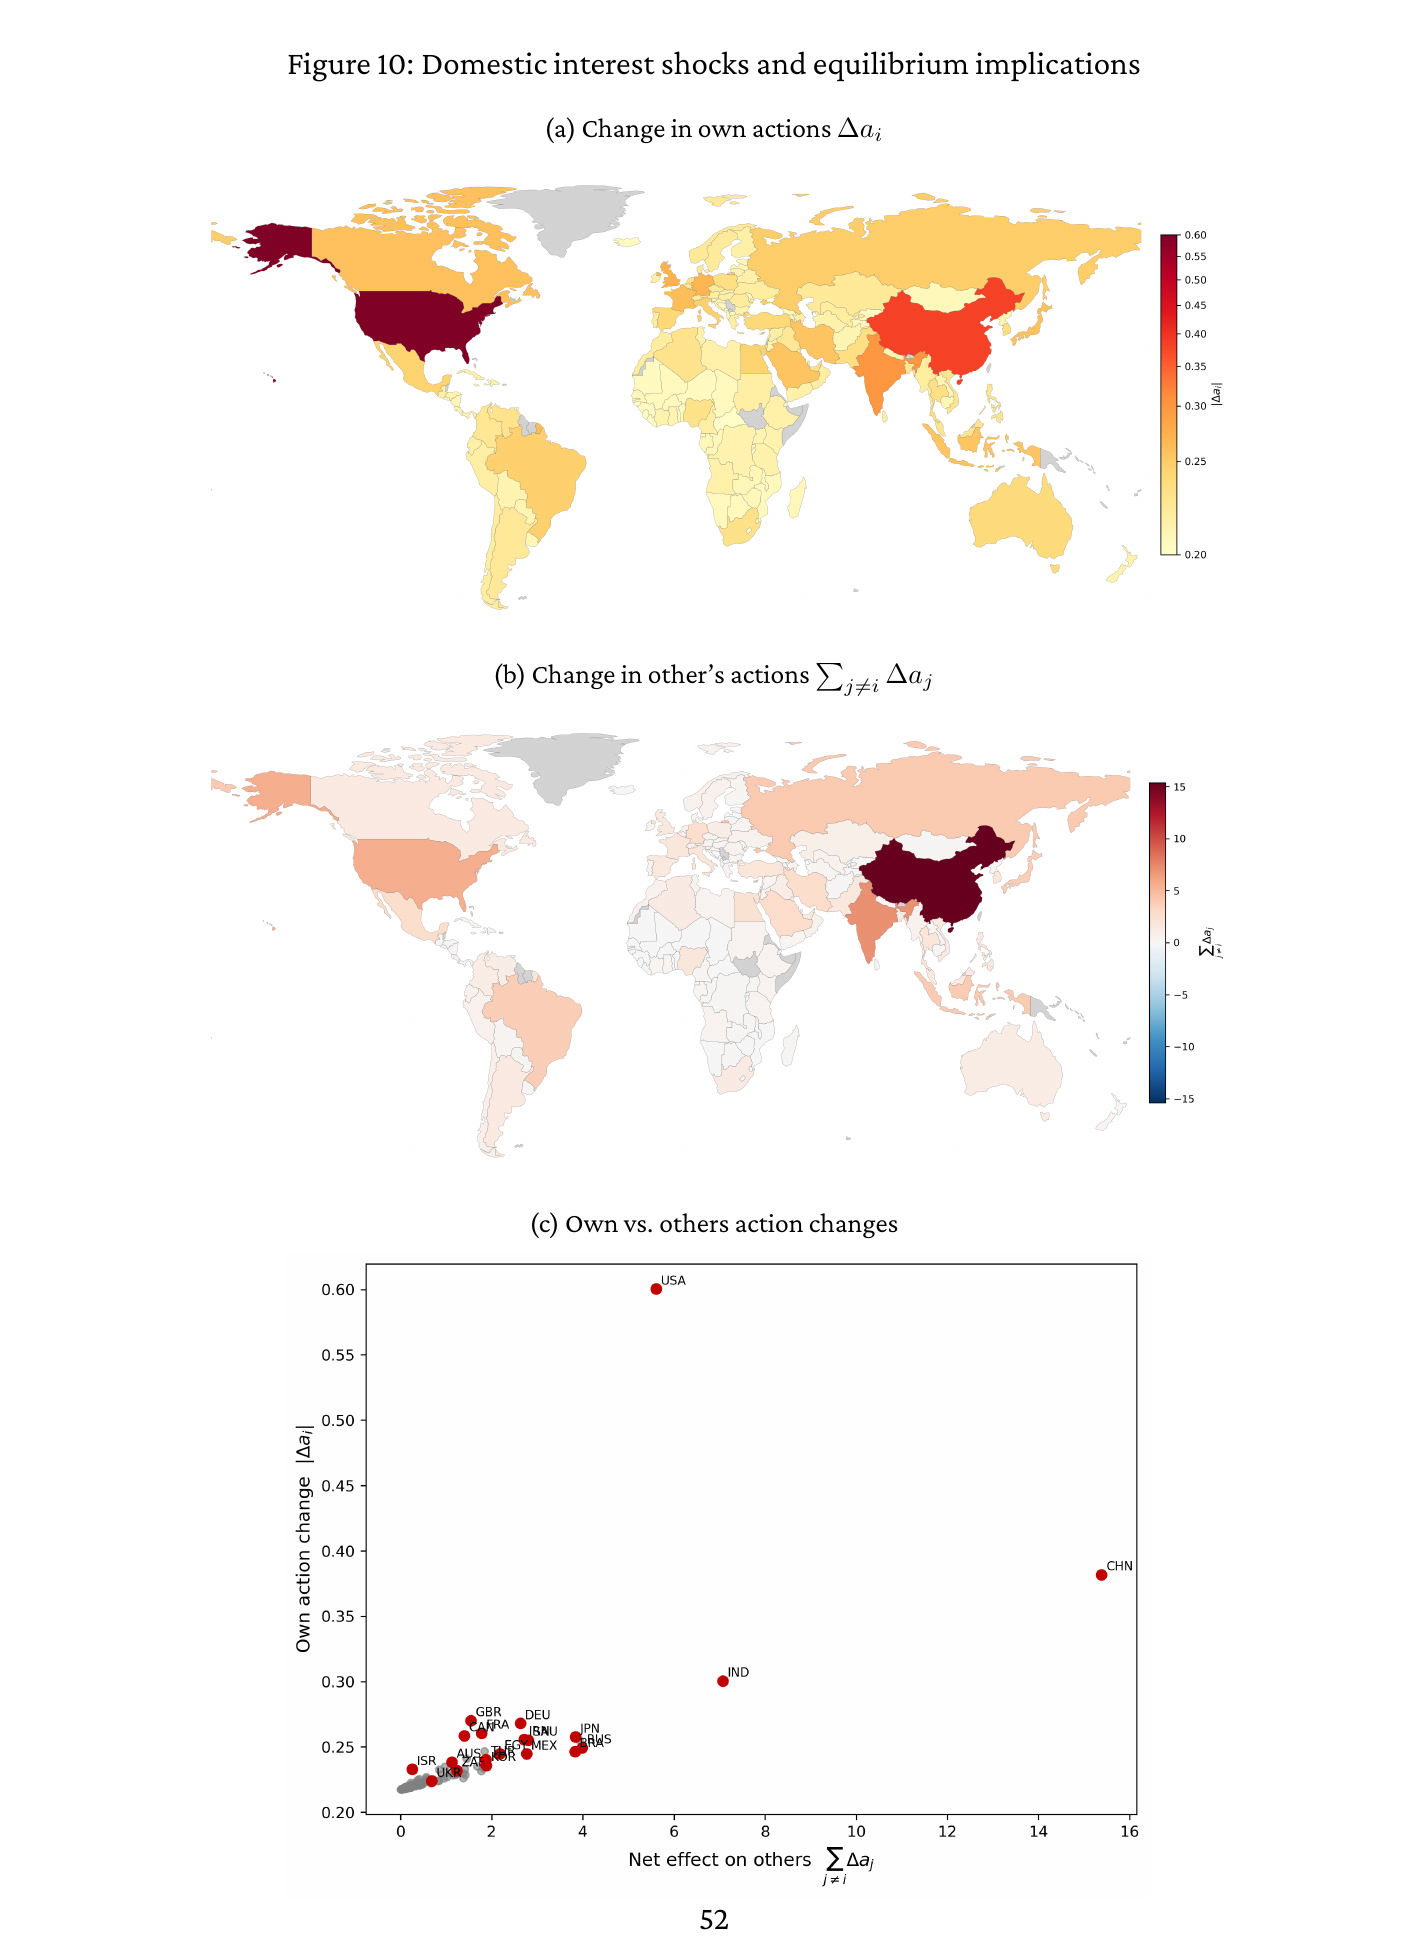
On autonomy the United States and China stand alone: a unit shock moves the American action by 0.60 and the Chinese by 0.38, against a quarter or so for nearly everyone else. Even the superpowers adjust substantially less than one-for-one; the network constrains them too. On influence China is first by a wide margin, and here the draft has a small inconsistency: the text ranks China, then the United States, then India, while its own panel (c) puts India at about seven and the United States at about 5.6. The order of the runners-up is not the point. The point is that the two dimensions come apart. The United States has more autonomy than influence, China the opposite: its own action is more constrained by its relationships, but a change in what it wants ripples further. Russia’s influence is disproportionate to its economy. The paper’s phrase is that power is a network property rather than a consequence of capabilities, and Liu was careful, at the talk and again in the Q&A, to add that it is a cleavage-specific one: this ranking is for the us–China divide, and on an India–Pakistan issue, as the paper itself says, the United States is peripheral.
One result from the talk is not in the draft at all. Liu showed a slide on which countries receive the most influence in the 2010s under simulated issues — Syria, Iran, Yemen and Venezuela, countries at the center of conflicts and bridges between blocs, and, a little awkwardly, the United States, with China receiving far less. It is the sort of thing the contestability index is built for, but the draft only exercises that index on the toy network, so treat the country list as a talk result rather than a paper result until a later version prints it.
What the room pushed on
Clayton’s discussion was generous on the mechanics and pointed on the interpretation. Having renamed self-influence defensive statecraft, he looked at the own-versus-others figure and observed that nearly every country translates about a quarter of an interest shock into its own action while the ability to move others is concentrated in China, India and the United States, and asked whether a two-player or very-small- hegemon model is, after all, a good approximation to the world — a question of some interest to a person who writes hegemon models. His second comment was that the network of actions being coordinated may not be the network of instruments — sanctions, export controls, military capacity — used to influence them, that his prior is the United States and China dominate the latter, and that coalitions like the eu and the brics aggregate influence in ways the model’s bilateral pushes do not. His third was that the network is exogenous here while much of what great powers do — American dominance of the financial system, export controls that contain technology, or at the other extreme a retreat into autarky — looks like investment in reshaping the graph. And his last was a modeling choice: he might have written the American objective as wanting China to take America’s action, which is a better description of export controls than wanting to align with China, and he wondered which micro-foundation fits which context and whether the decomposition survives the change.
Liu took the offensive-and-defensive framing gladly, answered the hegemon question with the cleavage-specificity point — how many countries matter depends on the issue as well as the network — and said a dynamic version, in which this period’s influence shapes next period’s network, is the follow-up in progress. The instruments-versus-actions point went unanswered on the tape. From the floor, one questioner asked how much of the stationarity assumption is really needed and observed that measuring interests is not obviously easier than measuring the network, since both are large objects; another, following Clayton, argued that the micro-foundations differ between public-good issues, where similar countries want the same thing, and rival-good issues like Jerusalem, where they want the same thing for themselves. Liu’s answer to the second is worth keeping: the model does not require similar countries to be connected. The assumption is only that the cleavages organizing the interest covariance are the basis for the network; the loadings can be negative or weak, and what identifies a link is countries acting alike when their interests are not, not countries having similar interests. He also allowed that one could estimate a separate network per issue domain, climate and so on. Someone named Emily — the recording gives only the first name — asked about separability, and only the answer survives: the political-science term is issue linkage, many issues negotiated jointly, and the paper has not analyzed it. A second round asked whether China and the United States should move first; Liu listed Stackelberg timing, and a subset of countries colluding on an issue, as unexplored one-shot extensions, the dynamics work being about network evolution, and Clayton added that ex-ante influence already has a flavor of investing to change the environment. Pressed on how far the asymmetry can go, Liu gave the honest answer: spectral decoupling needs quasi-symmetry and fails more generally, at which point the theory survives but taking it to data would need a different identification strategy. A suggestion to use the World Values Survey as an alternative measure of interests — only the reply is audible — got “great suggestion” and a promise to think about feasibility.
The last answer on the tape was about the actions. Liu’s line was that the model is deliberately reduced form — the actions can be sanctions or military moves, the model does not care — but that the only systematic panel of every country acting on every issue is un voting, so that is what the empirics use, and the model can be read more liberally than its data. That is fair, and it is also a little funny, because the one arena where every country takes a public position on every issue, several times a year, is the arena where the position costs almost nothing and is taken in full view of your allies. A vote whose main consequence is who you are seen standing with is not a compromised measure of a beauty contest. It is, more or less, the definition of one.